
eCommerce
eCommerce
15 Essential Metrics for Your Ecommerce KPI Dashboard in 2026
-
Vikash Sharma
- Apr 14, 2026
- 10 mins read
You’re running reports. You’re watching dashboards. But you still do not know if your store is truly healthy. Does this sound familiar? The majority of the ecommerce operators are not failing due to a lack of data. The reason they are not succeeding is that they are measuring the wrong things, or, worse, the right things in silos that never get related.
The actual issue is as follows: unless you have a cohesive ecommerce KPI dashboard, your sales, marketing, and operations teams are looking at different numbers. Nobody is aware of the big picture, and that disaffiliation is costly in real money.
All this is solved by a well-developed ecommerce performance dashboard. It brings your most important data into a single and up-to-date display so all stakeholders, from the CMO to the warehouse manager, can make well-informed decisions.
Regardless of whether you operate a high-volume DTC brand, a Shopify store, or a multi-channel business, the appropriate KPIs will change the way you do things.
In this guide, we will discuss the 15 key ecommerce metrics your dashboard should include in 2026, including equations, benchmarks, and guidance.
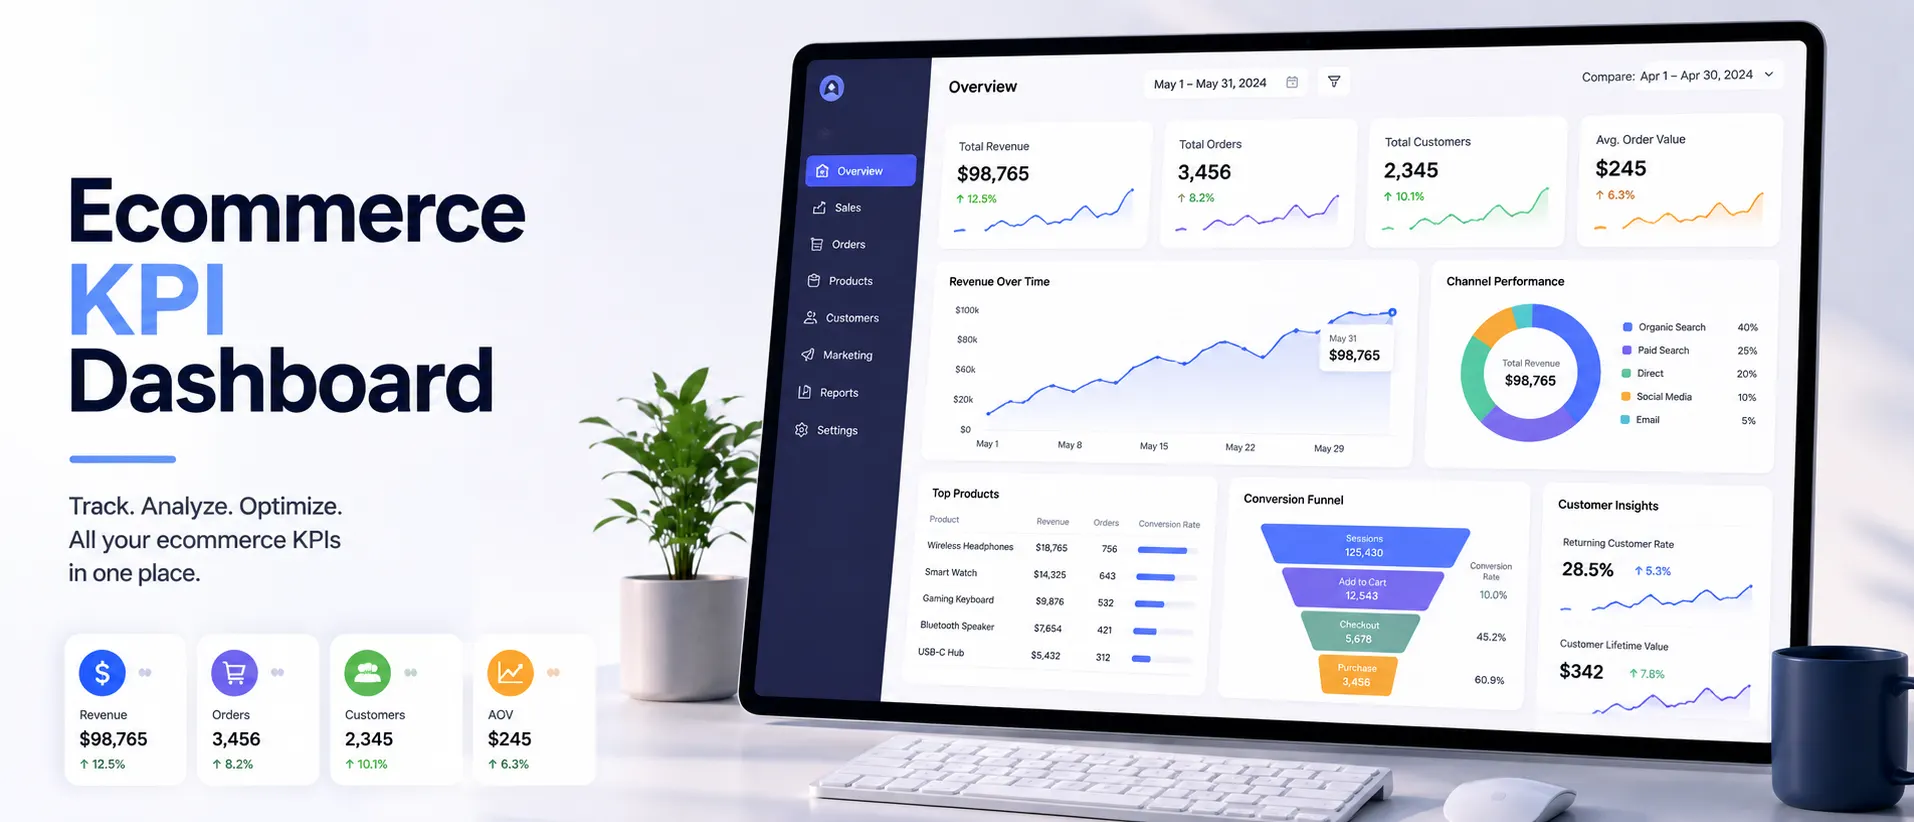
What is an Ecommerce KPI Dashboard?
An ecommerce KPI dashboard is a unified, real-time visualization platform that easily consolidates the most significant performance indicators of your store, like sales and revenue, customer behavior, and marketing performance, etc., into one, actionable display.
Think it is the cockpit of your web shop. In the same way, a pilot does not have 200 separate instruments in the cockpit, but rather a synthesized flight display that translates raw data into easily understandable signals.
The ecommerce dashboards available today are drawing in data across various sources: Shopify, Google Analytics, Meta Ads, email services, CRM software, and inventory management tools, and displaying it in single, filterable formats.
A real-time ecommerce dashboard is no longer just a dashboard that tells you what happened last month, but it tells you what is happening now and what is likely to happen in the future.
Why These Metrics Matter More Than Ever in 2026?
The data-rich and fragmented nature of the ecommerce landscape in 2026 is more competitive than ever.
The average customer acquisition cost has increased significantly over the last three years, and the loss of signals on ad platforms persists even after changes, while customers demand hyper-personalized experiences across all touchpoints.
In this context, operators that develop a disciplined ecommerce reporting dashboard aligned with the appropriate KPIs always perform better than those that do not. That is why the metrics that you select are important:
|
Dashboard Type |
What It Measures |
Best For |
| Sales KPI Dashboard | Revenue, transactions, AOV, growth | Founders, Sales Teams |
| Marketing KPI Dashboard | Conversion, CAC, ROAS, traffic | Marketing Teams |
| DTC Performance Dashboard | CLTV, retention, NPS, cohorts | DTC Brands |
| Shopify KPI Dashboard | Store-level metrics + product data | Shopify Merchants |
| Operations Dashboard | Returns, refunds, inventory turns | Operations Teams |
Ecommerce KPI Framework: Metrics That Drive Growth & Profitability
Tracking the right ecommerce KPIs is essential for understanding how your business is truly performing beyond surface-level growth. This framework breaks down the key metrics across sales, financials, marketing, and customer behavior to help you make data-driven decisions, improve profitability, and scale sustainably.
-
Sales KPIs: The Heartbeat of Your Store
Sales KPIs indicate the level at which your store is effective at translating traffic into transactions and vice versa. These are the initial measurements that any founder, operator, or investor will be interested in, and they must come first on your sales KPI dashboard.
1. Total Revenue
Your baseline is total revenue. It is the total dollar volume your store makes before costs, returns, or refunds are deducted.
Although it does not answer the question of whether you are profitable, it presents the overall sales generated before costs. on your dashboard and indicates whether your business is developing.
Total Revenue = Units Sold × Average Selling Price
Best Practice:
Plot total revenue and cost of goods sold (COGS) together on the same plot so you never miss the margin story, but only the top line. This is automatically done by the revenue analytics module using side-by-side trend lines.
2. Monthly Sales Growth Rate
Monthly sales growth provides insight into the trend and pace of your business. The value of a 10% growth rate (MoM) compounded continuously is much better than a one-time spike.
This measure can help you determine whether seasonal campaigns, product introductions, or channel expansions are actually moving the needle.
Sales Growth (%) = ((Revenue This Month − Revenue Last Month) ÷ Revenue Last Month) × 100
Benchmark: A typical Healthy DTC brand is expected to achieve 5-15% MoM growth in scale stages. Mature brands are looking at a stable 2-5% growth with high margin retention.
3. Average Order Value (AOV)
One of the strongest levers in ecommerce and underutilized is AOV. Gaining just $10 in AOV can significantly increase profitability without the need to drive up traffic. It is the default measure used to assess upsell, cross-sell, and bundling strategies.
AOV = Total Revenue ÷ Number of Orders
4. Shopping Cart Abandonment Rate
The overall rate of cart abandonment in ecommerce is about 70.22%. That is equivalent to 7 out of 10 shoppers who will add to their cart and fail to purchase. This measure directly measures revenue lost and indicates a bottleneck in your checkout process – whether it be unexpected shipping fees or having a slow payment process.
Abandonment Rate (%) = (1 − (Completed Purchases ÷ Cart Initiations)) × 100
A drop in abandonment rate of even 5% points can unlock significant incremental revenue without spending a single extra dollar on ads.
-
Financial KPIs: Profitability Over Vanity
Revenue is exciting. Profit is sustainable. These financial indicators make your ecommerce metrics dashboard more of a business health monitor than a growth tracker, the difference between a scaling smart business and scaling an insolvent business.
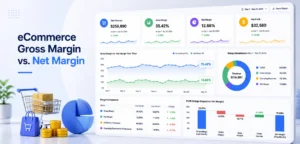
5. Gross Profit Margin
Gross profit margin shows the percentage of revenue left after deducting the direct cost of goods sold. For ecommerce brands, healthy gross margins are usually 40-60% for physical goods and 60-80% for digital goods.
With gross margins under pressure, maintaining all other measures on your dashboard will be more difficult.
Gross Profit Margin (%) = ((Revenue − COGS) ÷ Revenue) × 100
6. Revenue Per Visitor (RPV)
RPV combines traffic efficiency and conversion effectiveness into a single number. It will respond to the inquiry: “How much money does every individual who visits my shop make?
This measure is particularly effective for comparing the ROI of various marketing channels on a like-for-like basis.
RPV = Total Revenue ÷ Total Number of Visitors
Pro Tip:
Add RPV segmented by acquisition channel to your ProactiveAI marketing KPI dashboard to find out which channels bring the highest-quality traffic – and not just the highest volume.
7. Customer Acquisition Cost (CAC)
CAC measures the cost you pay to acquire one new paying customer. Due to increased ad expenses, most DTC brands have seen CAC exceed the proceeds from the initial purchase, and retention and CLTV strategies are no longer nice-to-haves.
CAC and CLTV should always be shown on your DTC performance dashboard as they help to tell the story of unit economics.
CAC = Total Marketing & Sales Spend ÷ Number of New Customers Acquired
Rule of thumb: A healthy, scalable business should have a CLTV: CAC ratio of 3:1 or higher.
-
Marketing KPIs: What Really Grows the Business.
All the money that you spend on marketing must deliver measurable returns. These four metrics form the foundation of any marketing KPI ecommerce strategy, helping bridge the gap between overall business performance and campaign spending.
8. Conversion Rate (CVR)
Conversion rate is the percentage of visitors who can perform a desired activity, typically making a purchase. It is the most straightforward measure of the performance of your store, product pages, and checkout experience. The mean ecommerce CVR is 1-3%; the best performing stores have 4-6%.
CVR (%) = (Number of Purchases ÷ Total Visitors) × 100
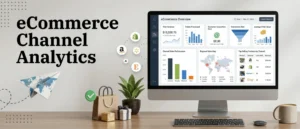
9. Traffic by Source
All traffic is not equal. Knowing the distribution of your traffic by channel: organic search, paid social, email, direct, referral, allows you to refocus on what is working and cut what is not.
This should always be shown as a percentage breakdown with the revenue contribution per channel on your online store dashboard.
With paid platforms continuing to experience signal loss in 2026, owned channels (email, SMS, organic SEO) are providing ever better CAC and conversion rates to those brands that invested in them.
10. Bounce Rate
Bounce rate measures the percentage of visitors who leave a page without engaging in any other activity.
A high bounce rate on a product page is an indication of incompatibility between ad creatives and landing page content – or a bad page experience. Achieve a bounce rate of less than 40% on important landing pages.
Bounce Rate (%) = (Single-Page Sessions ÷ Total Sessions) × 100
11. Email & Campaign ROI
Email is the most profitable ROI channel in ecommerce, with industry averages of 36-42% return on a dollar spent. That ROI, however, depends heavily on the quality of the list, segmentation, and deliverability.
The ability to track your campaign level revenue, open rates, and click-through rates, and revenue per email sent on your ecommerce reporting dashboard is non-negotiable, regardless of the brand investing in owned marketing.
Email ROI (%) = ((Revenue from Email − Email Costs) ÷ Email Costs) × 100
- Customer KPIs: Building a Business That Lasts
It costs 5-7 times as much to acquire a new customer as to retain an existing one. These four measures enable your ecommerce performance dashboard to have one eye on the future, not the present quarter.
12. Customer Lifetime Value (CLV)
The most crucial indicator for any ecommerce brand concerned with sustainable growth is CLV. CLV estimates the total revenue a customer generates over their relationship with your brand.
High CLV brands are able to spend a higher amount on acquisition – a structural competitive advantage.
CLTV = Average Order Value × Purchase Frequency × Customer Lifespan
A model with unprofitable unit economics can be turned into a healthy model with 10-20% improvement in CLV, whether through loyalty programs, subscriptions, or improved post-purchase experiences.
13. Customer Retention Rate
Customer retention rate deals with the percentage of customers who come back to make a second (and third and fourth) purchase. It is the most important predictor of brand loyalty and directly influences CLV.
The retention rates of top ecommerce brands are 30-45% per year; the average is around 20-25%.
Retention Rate (%) = ((Customers at End of Period − New Customers) ÷ Customers at Start) × 100
14. Net Promoter Score (NPS)
NPS poses a misleadingly easy question: How likely are you to recommend us to a friend? Promoters (9-10) and detractors (0-6) are motivators and indicators of organic growth and brand risk, respectively, on a 0-10 scale.
NPS is not merely a score of satisfaction, but a leading indicator of churn and word-of-mouth growth potential. A brand with an NPS greater than 50 always outperforms its category.
NPS = % Promoters − % Detractors
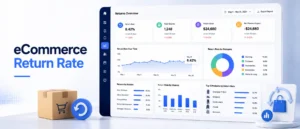
15. Return & Refund Rate
Ecommerce returns are generally 20-30% for clothing and 5-10% for electronics, respectively. However, an increased return rate is hardly ever an operations issue, but an indication of a product description problem, a quality control problem, or a sizing/fit problem.
The ability to track returns by SKU, category, and traffic source on your ecommerce metrics dashboard enables you to diagnose root causes before they start to eat away at your margins.
Return Rate (%) = (Number of Returns ÷ Total Orders Sold) × 100
How to Create Your Ecommerce KPI Dashboard: 5-Step Framework
Knowing which metrics to track is only the first step. The real impact comes from how you build and use your dashboard.
1. Identify your decision-makers
Create separate dashboard displays for executives (revenue and profit), marketing teams (CAC, CVR, ROAS), and operations (returns, retention). A single dashboard that attempts to serve them all serves none of them.
2. Link all your data sources
The quality of your dashboard is as good as the quality of its information. Install a solution such as ProactiveAI, which can natively connect with Shopify, WooCommerce, Google Analytics 4, Meta Ads, and your email provider and remove the need to assemble data manually.
3. Establish goals, not measures.
A number without a target is just data. Assign goals to every KPI (e.g., “CVR ≥ 3.2%”, “CAC ≤ $42”) so your dashboard immediately signals whether you’re on or off track with color-coded status indicators.
4. Automate your reporting calendar
Automate email digests for your team. Stakeholder weekly performance reports. Monthly deep-dives for strategic review. All this is automatically done by ProactiveAI with no manual work.
5. Revise and develop quarterly
The KPIs of greatest interest will change as your business matures. A start-up with a pre-revenue business will measure different metrics than a brand with $10M in ARR. Incorporate a quarterly dashboard review into your operating cadence.
Why ProactiveAI is the Most Suitable eCommerce KPI Dashboard for You?
We created ProactiveAI, a platform to support ecommerce operators, as we know how frustrating disjointed data and disconnected teams can be.
We combine your Shopify, WooCommerce, Google Analytics 4, Meta Ads, and email apps, and CRM data into one, real-time dashboard, no manual imports, no guesswork.
Each team focuses on the most important tasks: marketing on CAC and ROAS, sales on revenue and AOV, and operations on returns and inventory. Our self-service analytics, powered by AI, bring out trends, anomalies, and opportunities as they occur, and automated reports inform us daily, weekly, or monthly.
ProactiveAI gives you a single source of truth, actionable insights, and the freedom to develop your KPIs as your business expands, enabling smarter decisions and sustainable growth.
Conclusion
The distinction between an underperforming ecommerce shop and a successful one is often not the product, advertising budget, or the number of people working on it. It is the quality of the decisions being made, and that quality is directly related to the quality of the data on which those decisions are based.
These are the 15 critical KPIs that are your starting point. Turn them into a live ecommerce dashboard, integrate them into the daily routine of your team, and have specific goals for each of them.
Using a tool such as ProactiveAI, you can pull together all sales, marketing, financial, and customer metrics into one easily actionable view. This eliminates silos, enables smarter decisions, and gives you an advantage over competitors still relying on gut instinct.
Now we must make use of your valuable data and create your cohesive ecommerce dashboard today with ProactiveAI and boost your sales and business growth.
Frequently Asked Questions
What KPIs ought to be on an ecommerce dashboard?
It should include sales (revenue, AOV, growth), financial (gross margin, RPV, CAC), marketing (conversion rate, sources of traffic, campaign ROI), customer (CLTV, retention, NPS), and operational (returns, refunds, inventory) metrics on your dashboard to provide a complete picture of business health.
How often should you review your ecommerce KPI dashboard?
The frequency of review is determined by the metric: conversions and traffic are reviewed in real-time, AOV, cart abandonment in daily, CAC and returns in weekly, revenue and retention in monthly, and strategic KPIs such as NPS and CLTV are reviewed monthly.
Which is the most effective tool to construct one?
The most advantageous solution is one that combines all your data sources, provides real-time analytics, offers a customizable dashboard across teams, automates reporting, and delivers predictive insights. ProactiveAI is specifically designed to meet ecommerce needs and addresses all these needs.
Is it possible to integrate my ecommerce dashboard with Slack or email?
Yes. ProactiveAI enables the insertion of visual summaries into Slack channels or automated email reports, keeping a team informed without requiring them to log in to multiple services.
How can I automate alerts on my dashboard?
Set thresholds for each KPI (e.g., CVR < 2%, CAC > $50). Then activate notifications either through email or Slack. Proactive AI helps with anomaly detection, so you are immediately notified when metrics fall outside expected ranges.
You might also like
Handpicked articles for your reading list.

Get the latest insights on Conversational AI
Stay ahead of the curve with weekly updates on data analytics, AI trends, and eCommerce growth strategies delivered straight to your inbox.
Join 5,000+ industry leaders. Zero spam, just pure insights.