
eCommerce
eCommerce
Ecommerce Reporting Tools in 2026: How to Choose the Right One for Your Brand
-
Vikash Sharma
- Apr 20, 2026
- 10 mins read
Your data is everywhere, but your insights are not. Orders flow through Shopify. Ad spend is split across Meta, Google, and TikTok. Email of customers waiting in Klaviyo. Inventory data sits locked inside your 3PL system. And amidst all this clatter, your team needs to answer one critical question that counts: Is the business growing in a profitable way?
It is the main pain point that any ecommerce brand, whether a scrappy DTC startup or a growing omnichannel retailer, will encounter in 2026. The data exists. The issue with this is that it exists in silos, is manually dragged into spreadsheets, and the reports are out of date by the time anyone reads them.
By then, your ad budget is already overspent. The stockout has already occurred. The high-LTV group was already churned.
The appropriate ecommerce reporting tool does not simply assemble numbers in a pile, but it converts piecemeal information into a single source of truth that can be used by your marketing, operations, and finance groups.
It substitutes the weekly data dump meeting with a real-time dashboard. It eliminates guesswork through cohort analysis, contribution margin tracking, and predictive signals, allowing you to be ahead of issues rather than responding to them.
This guide is a breakdown of what ecommerce reporting tools are, how to consider the best options available on the market in 2026, and how to use a purpose-built intelligence platform for modern brands.
What Are Ecommerce Reporting Tools?
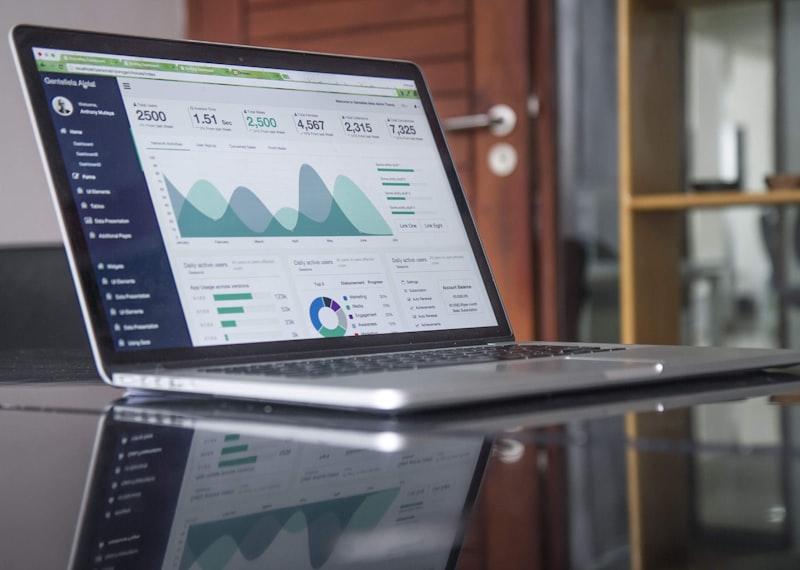
Ecommerce reporting tools are platforms designed to aggregate, consolidate, and visualize data from every system an online store depends on. These tools integrate data from storefronts, advertising platforms, email marketing systems, payment processors, inventory management tools, and customer databases into a single, unified view.
They function as a central command center for monitoring and evaluating brand performance. Instead of requiring users to access multiple dashboards to review daily activity, ecommerce reporting tools provide one comprehensive interface that presents all key metrics in real time.
With these tools, businesses can track important performance indicators such as revenue, advertising efficiency, customer lifetime value, repeat purchase rates, inventory health, and profit margins all in one place.
What They’re Not
Being specific helps, as there are too many similar tools in the market. An ecommerce reporting tool is different from:
- General BI tools, such as Tableau or Power BI, are powerful but require significant engineering to implement and are not e-commerce-native.
- Web analytics tools like Google Analytics 4 are Great for tracking traffic, but limited for profitability insights or customer cohorts.
- Platform-native reports such as Shopify Analytics are good for getting simple store metrics, but not for accessing ad data, email performance, or margin.
- Dashboards based on spreadsheets are flexible, yet manually maintained, error-prone, and infamously slow to update.
On top of all these layers is true ecommerce analytics software. It connects to all sources of data, standardizes the data, and provides automated and actionable insights.
Why Your Current Setup is Failing You
To be specific, when you do not have an adequate ecommerce reporting system, what goes wrong is:
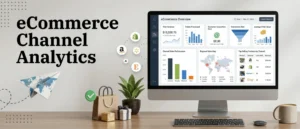
01. Data Fragmentation across Channels
Each of your Shopify stores, Amazon seller accounts, Meta Ads Manager, and Google Ads has a dashboard. They don’t talk to each other. Your total Return on Ad Spend (ROAS) is never an actual number, but it is rough data.
02. Delayed Reporting Cycles
The majority of the teams are examining last week’s data to inform this week’s decisions. By the time you can report on Monday morning, the bleeding budget campaign will have taken its toll.
03. Missing Profitability Metrics
Revenue is simple to report. Actual profitability, the amount that you really make after you have considered COGS, returns, shipping, and ad spend, will tell you whether you are making money. This does not appear in most tools unless heavily customized.
04. No Customer-Level Intelligence
You are not certain which channel of acquisition leads to your most loyal buyers, so you maximize by volume, rather than value.
05. Spreadsheet Dependency
A single point of failure occurs when your BI process is a Google sheet that is updated by a single analyst once a week, on Fridays. One mistake in the formula, one overlooked export, and your leadership group makes decisions based on poor numbers.
Key Features to Look For in 2026
There is a great deal of maturity in the ecommerce analytics. The following are the characteristics that distinguish between truly useful platforms and fancy dashboards:
1. Native Integrations
Connects natively with Shopify, Amazon, Meta, Google Ads, Klaviyo, and your 3PL, without custom ETL engineering.
2. Real-Time Dashboards
The refresh rate of data should be hourly or even less. Every day is over with a lag time that burns the budget in minutes when ad platforms are used.
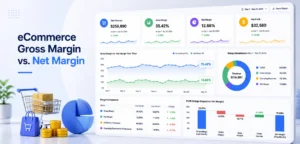
3. Contribution Margin Tracking
Net revenue less COGS, returns, shipping, and ad spend by SKU, channel, and cohort. This is the figure that really counts.
4. Customer Cohort Analysis
Repeat purchase rates, LTV curves, and churn risk by acquisition channel, first product purchased, and promo type.
5. AI-Powered Insights
Detection of anomalies, churn prediction, and revenue forecasting engines are no longer hidden in bespoke reports.
6. No-Code Reporting
Your data analyst should not be required to answer simple questions by your marketing and ops teams. No-code ecommerce reporting tools are the best here that provide you with a direct answer in conversational form.
7. Inventory Intelligence
Predicted stockouts, sell-through rates, and overstock alerts combined with your sales velocity data.
8. Automated Reporting
Automate reports scheduling, email digests, and Slack notifications so no one needs to drag information out of it themselves before it gets to the appropriate recipients.
Types of Ecommerce Analytics Platforms
It is necessary to become familiar with the four primary platform types in the market before comparing specific tools. All are useful to different requirements, and most brands find themselves relying on more than one:
Platform-Native Analytics
Installed on your storefront (e.g., Shopify Analytics). Good beginning, with a narrow scope on-platform data only and no cross-channel visibility.
Ecommerce Specific BI Tools
Specialized applications such as ProactiveAI, Triple Whale, or Northbeam, built on DTC and ecommerce data models and featuring built-in metrics and connectors.
General BI Platforms
Applications such as Looker, Power BI, or Tableau. Very flexible, but would take considerable time to set up and data engineering resources to be useful in ecommerce.
Attribution & Marketing Analytics
Attribution-based platforms (Northbeam, Rockerbox). Very good at media mix modeling, but not a complete substitute for ecommerce reporting.
A sweet spot among most up-and-coming ecommerce brands is an ecommerce-focused BI tool, one with the richness of a general BI tool plus pre-built connectors, ecommerce-specific measures, and sufficient no-code flexibility so that your skills and resources do not require an analyst to create every report.
Top Ecommerce Reporting Tools in 2026
The following are the best ecommerce analytics software you can use, and now let’s see what they excel at, and what they fail to achieve.
ProactiveAI (Best All-Around)
ProactiveAI is the best BI tool for ecommerce that is built on purpose to consolidate your storefront, advertising, email, and operational data into a single source of truth.
In contrast to generic BI tools, ProactiveAI is built with ecommerce native dashboards, contribution margin, cohort LTV, channel attribution, and inventory health, meaning that brands can onboard and go to insights in days, not months.
Its AI layer automatically identifies anomalies, predicts demand, and suggests budget reallocation. With no-code reporting, teams in marketing, finance, and ops can create their own views without engineering assistance.
| Strengths | Considerations |
|
|
Shopify Analytics (Best for Shopify Beginners)
Shopify Analytics Tools, built right into each Shopify account, offer a good starting point for merchants coming to the data. You get sales reports, customer reports, marketing attribution summaries, and basic cohort views, all without any additional setup.
But as brands grow and change their channel mix, the restrictions soon become apparent: there is no cross-channel attribution, no contribution margin, and no option to combine data outside the Shopify ecosystem.
| Strengths | Considerations |
|
|
Google Analytics 4 (Best to analyze traffic)
Free and industry-standard, GA4 continues to be the web traffic and user behavior analytics. For ecommerce brands, GA4 can provide conversion tracking, funnel analysis, and basic purchase reporting.
Nevertheless, it is designed as a behavioral analytics platform, not an ecommerce reporting platform. It does not include contribution margin, customer LTV, inventory, or post-purchase behavior.
It also has a steep learning curve, and when used to sample data from high-traffic stores, the results may be inaccurate.
| Strengths | Considerations |
|
|
Triple Whale (Best to DTC Attribution)
Triple Whale is one of the best DTC reporting tools in the market due to its first-party attribution engine, which helps brands achieve true ROAS on Meta, Google, and TikTok in a post-iOS-14 world.
Its Pixel technology and a summary dashboard are actually handy for performance marketing teams. Triple Whale diversified into AI-assisted analytics insights and customer analytics in 2026.
It is a powerful solution for ad-heavy DTC brands, but its contribution margin and inventory capabilities remain less developed than those of specialized ecommerce BI solutions.
| Strengths | Considerations |
|
|
Looker / Looker Studio (Best for Data Teams)
Looker (enterprise BI at Google) and Looker Studio (free) are capable of powerful, flexible data modeling. With brands that have a committed data engineering team, it is possible to customize Looker to solve virtually any business query.
The difficulty is that flexibility often requires extensive configuration. It has no ecommerce native templates, no pre-built Klaviyo/Shopify connectors, and no AI layer. It is a tool that can be scaled to your data team, rather than your marketing team.
| Strengths | Considerations |
|
|
Microsoft Power BI (Best for Microsoft Ecosystems)
Power BI is a widely used and well-developed BI platform that thrives in environments where Microsoft Azure and the Office 365 ecosystem are already in use.
To ecommerce brands within that stack, it provides powerful visualization features and a fairly approachable interface via Power BI Desktop.
But, like Looker, it will need bespoke connectors and data modeling to be useful for ecommerce-specific metrics, and its real-time data features lag behind those of ecommerce-native platforms.
| Strengths | Considerations |
|
|
Best Practices for Ecommerce Reporting in 2026
The selection of the appropriate tool is not the entire story. The decisions you make about how you plan and adopt your reporting platform will make or break your reporting. The following are best practices that distinguish between top ecommerce analytics functions and the others:
1. Define Your North Star Metric First
Before building a single dashboard, align your ecommerce team around the most appropriate metric that accurately measures business well-being.
This is not revenue but contribution margin per order or customer payback period of most ecommerce brands. All other dashboards ought to interpret or describe that measure.
2. Build for Each Team’s Decision Horizon
Your CMO requires information beyond what your warehouse manager provides. Organize your reporting lines so that executives can view 30/60/90-day trend data, and operators can view daily and hourly indicators.
Ecommerce dashboard software provides a platform for building role-specific views using the same underlying data, without duplicating reports.
3. Automate the Routine, Investigate the Anomalies
Automation should be done in the daily reporting. Your analysts ought to be busy with anomaly hunting and opportunity discovery – rather than exporting.
Implement reporting automation in ecommerce and establish alerts on large variations in the baseline metrics (ROAS decreases, conversion rate declines, inventory levels).
4. Connect Attribution to Profitability, Not Just Revenue
ROAS, when applied to revenue only, is the most threatening figure in ecommerce reporting. A channel with a 5 ROAS on low-margin products with a high return rate may not be as profitable as a channel with a 3 ROAS on high-margin, low-return products.
Never use top-line revenue to run attribution, but your contribution margin model.
5. Review Cohort Performance monthly
The most important (and the most lagging) indicator in ecommerce is the customer cohorts. Establish a monthly ritual to examine retention curves of your most recent 3-6 acquisition groups. Compare channel, first product, and promo type LTV trajectories using the cohort analysis of Use ProactiveAI.
How to Choose the Right Ecommerce Reporting Tool for Your Brand?
There are dozens of platforms available on the market, and too many options can slow down your decision. The following is a helpful guideline for reducing your selection based on where your brand currently sits:
You are a Shopify brand with less than 1M/year
Start with Shopify Analytics + Google Analytics 4. When you run paid ads on 2 or more channels and require attribution clarity, upgrade to ProactiveAI.
You’re scaling DTC at $1M–$10M
It is here that a special ecommerce BI platform is required. The appropriate level would be proactive AI or Triple Whale – consider depending on whether attribution or contribution margin is your most pressing pain point.
You are multi-channel with $10M+
Omnichannel consolidations, role-based access, and tailored data models are what you need. This is constructed by the Proactive AI Enterprise tier. Looker can be used when you have a data analytics team.
You are a data team and bespoke
In case you have your own engineers, Looker or Power BI can be configured to do pretty much anything, but allow 3-6 months to configure. ProactiveAI reduces that to days.
Frequently Asked Questions
What features should an ecommerce reporting tool have?
An ecommerce reporting tool must provide real-time dashboards, sales and conversion tracking, customer segmentation, cohort analysis, inventory insights, marketing attribution, customizable reports, automation, platform integrations, and actionable insights to help make data-driven decisions.
What is the difference between an ecommerce reporting tool and Google Analytics?
Compared with Google Analytics, ecommerce reporting tools are revenue-based, order-oriented, product-focused, and customer-centered. They also offer more sales data, profit analysis, and store analytics than Google Analytics, which is focused on website traffic, user behavior, and performance.
Which are the most appropriate reporting tools for Shopify stores?
Shopify’s best apps are Triple Whale, Lifetimely, and Daasity. The most suitable option will be determined by your needs, profit tracking, attribution, or customer insights.
Is it possible to automate ecommerce reports?
Yes, the majority of ecommerce analytics tools are automated. You can also schedule reports, build real-time dashboards, and connect to platforms such as Google Sheets or email, providing reliable and timely information without having to compile data manually.
What do I do to choose among various ecommerce analytics platforms?
Compare platforms in terms of integrations, pricing, user-friendliness, scalability, reporting capabilities, and support. Based on the size and objectives of your business, preview tools by using a free trial to confirm that it meets your needs in the workflow and decision-making.
You might also like
Handpicked articles for your reading list.
Get the latest insights on Conversational AI
Stay ahead of the curve with weekly updates on data analytics, AI trends, and eCommerce growth strategies delivered straight to your inbox.
Join 5,000+ industry leaders. Zero spam, just pure insights.