


AI & Analytics
Marketing
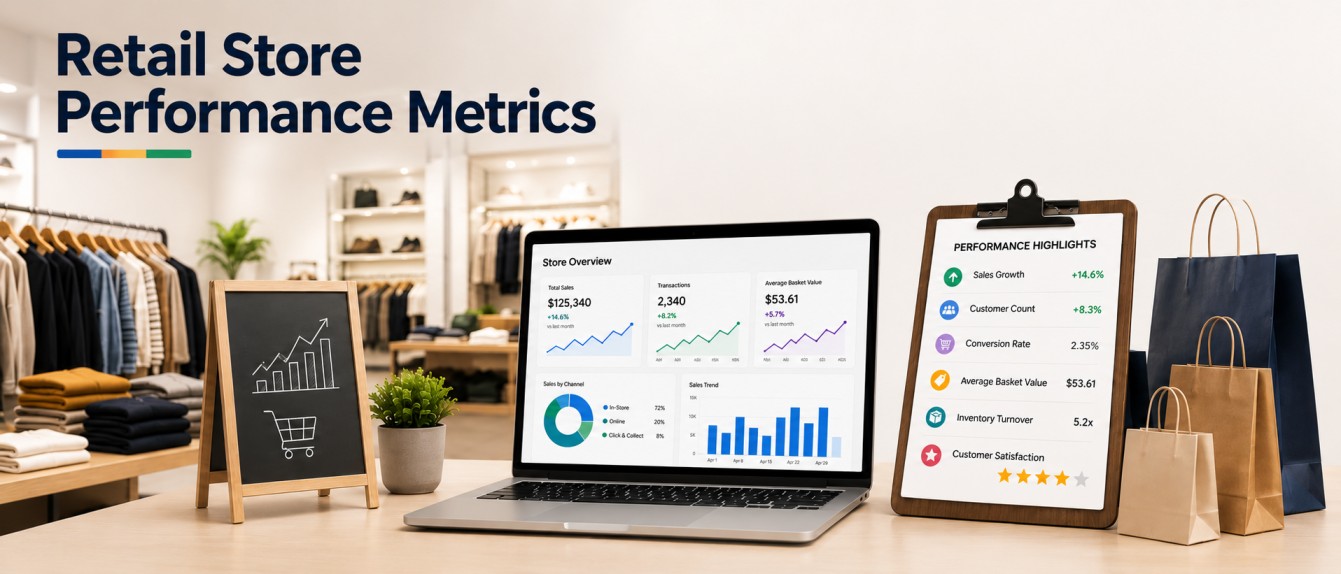
Retail Store Performance Metrics: Every Omnichannel Brand Must Track
-
Diksha Singh
- May 22, 2026
- 9 mins read
Brands that simply follow their instincts rather than data are losing the race quickly. Omnichannel brands are losing millions of dollars to unnecessary markdowns and missed reorder opportunities due to store-level blind spots, disparate point-of-sale data, and sell-in/sell-through mismatches.
But most retail brands are overwhelmed by data while lacking meaningful insights. You have thousands of transactions crisscrossing your POS system every day. You can track each click, cart, and conversion on your ecommerce platform.
Your wholesale partners report sell-throughs, which are often incomplete and delayed. Meanwhile, amid all the din, you’re asking yourself a seemingly simple question: Is my store really working?
The brands that will succeed in 2026 are those with a clear, unified vision for their retail store performance metrics. This holds true no matter how many channels and doors they have or how many SKUs they sell.
In real time, they understand which stores deserve investment, which products sit on the shelf, and why and where to invest more.
This guide identifies the key retail analytics KPIs that all omnichannel brands should monitor, defines which metrics to focus on, and which to ignore.
What Are Retail Store Performance Metrics?
Retail store performance metrics are measurable indicators used to evaluate how efficiently physical and digital stores convert resources into revenue and profit. Consider them the vital signs of your retail business, where each metric offers value on its own but yields stronger insights when analyzed together.
At its most basic, retail performance analytics combines three data sets: sales transactions, inventory positions, and customer behavior.
A powerful retail analytics dashboard brings all three together in one place and provides actionable insights without requiring a data science team to interpret the data.
Why Omnichannel Brands Need a Unified Analytics View?
For brands selling across multiple channels, whether it’s direct-to-consumer ecommerce, brick-and-mortar retail, wholesale customers, or marketplaces, analytics complexity becomes a major operational challenge.
Your Shopify store operates on one data structure. Your wholesale partners provide 10 different types of Excel files. The retail partner’s POS data is delayed by 30 days. Your local sales reps use their own spreadsheets. The result? A disjointed and confusing image that makes it difficult to make coordinated decisions.
However, Omnichannel retail analytics fills this gap by providing the single source of truth, one dashboard where the performance data from each touchpoint is normalized, reconciled, and can be compared against each other. Operational benefits rapidly follow:
- Recognize accounts that are not working out before they become a problem
- Match inventory replenishment to actual sell-through velocity, not based on gut feel.
- Compare the margin available in the DTC channel versus the wholesale channel, and be correct.
- Detect and respond to regional fluctuations before they lead to stockouts.
- Provide sales reps with account-level sales data to use during sales calls.
Today, retailers use an ecommerce analytics dashboard that gathers data from all channels, offering a real-time, visually appealing overview of performance by store, product, and customer.
Core Retail Sales Performance KPIs You Must Track
Here are the retail sales KPIs that help businesses shift from reactive decisions to proactive planning.
Net Sales Revenue
Total revenue excluding returns, allowances, and discounts. The basic metric (but only useful with COGS and margin).
Sell-Through Rate
Units sold ÷ units received × 100.
The truest indicator of product-market fit at the store level. Benchmark: 80%+ within the first 4 weeks for fast fashion; 60%+ for hard goods.
Gross Margin Return on Investment (GMROI)
Gross profit/average inventory cost. Shows you how much you are squeezing from each dollar invested in stock. The GMROI should be greater than 3.2 for a normal retail business.
Average Transaction Value (ATV)
The number of transactions = Gross profit ÷ average inventory cost.
An increasing ATV often reflects successful upselling and product bundling, while a declining ATV may indicate excessive discount dependency.
Conversion Rate
Conversion rate = Transactions ÷ foot traffic × 100.
A high-traffic, low-converting store is a clear sign of a merchandising or staff effectiveness issue. It is a critical link between traffic and revenue.
Inventory Turnover
Inventory Rate turnover = COGS ÷ average inventory.
Efficient capital deployment = high turnover. Low turnover = dead money in slow-moving stock. There are wide industry differences: grocery is 14×, and apparel is 3–4×.
Sales per Square Foot
Sales per Square Foot = Total sales minus the cost of sales / total selling area.
The standard to measure physical retail productivity. Apple stores generate more than $5,500 in sales per square foot. For comparison, the average retail price is roughly $325 in the US.
Customer Lifetime Value (CLV)
The expected value of a customer for the lifetime of that relationship. The lifetime value of a customer. CLV merchandising creates an assortment based on long-term loyalty, not short-term transactions.
Today, retailers with the best performance are using demand forecasting software to better predict demand, making more informed inventory and replenishment decisions with reduced risk of markdowns and better margins.
Sell-In vs. Sell-Through: The Metric That Reveals True Demand
When it comes to analytics, one thing that can really catch brands by surprise is the massive gap between sell-in and sell-through. Getting this wrong is one of the costliest mistakes a brand can make in multi-door and wholesale retail.
While “sell-in” measures the inventory you ship to retailers to make your sales team look good, “sell-through” is the number that actually matters. It tracks what reaches the end consumer.
Monitoring sell-through at the door level gives brands the flexibility to step in early: move stock from low-velocity to high-velocity doors, initiate promotions, or modify wholesale forecasts prior to the start of the markdown cycle.
ProactiveAI’s Sell-Through Analytics module automates this reconciliation throughout retail partners and alerts at-risk accounts in real time.
Door-Level Retail Analysis: Granularity That Drives Action
Chain-level reporting may appear simpler because it reduces performance into a single view. However, the aggregate figures mask the performance differences between individual store locations, and it is in the differences that reality exists.
Door-level retail analysis breaks down your performance data to the individual store level, giving you a fundamentally different level of insight:
- Top door identification: Where do they do better than the rest of the region, and what can be replicated in terms of merchandising, staffing, or layout?
- Situational analysis: What is the problem with an underperforming door? Is it a demand problem, an inventory problem, or an execution problem?
- Rebalancing stock: Moving stock from low-sell-through doors to high-demand areas before it is “aged”.
- Leverage for buyer negotiations: Door-level performance data provides your sales team with hard, believable proof in your favor when requesting prime shelf or additional SKUs.
POS Analytics & Ecommerce: Bridging the Data Gap
Point-of-sales systems are treasure troves of behavioral data, but most brands only scratch the surface. POS analytics ecommerce convergence is the technique by which you move away from silos and see your physical POS data and your digital transaction data as part of the same customer data.
Patterns emerge when you combine data from the POS with ecommerce behavioral data:
- Research Online, Buy Offline (ROPO) customers account for 28% to 38% of purchases across many categories. Consequently, they often remain invisible to companies that measure digital and physical sales channels separately.
- Weak online performance does not necessarily indicate a product issue; rather, it is more likely due to poor content or photography, especially since the SKUs that underperform online often see high in-store conversion rates.
- Return rates for the exact same product can vary widely across different sales channels. This variation has direct, practical implications for product sizing, packaging design, and the accuracy of product descriptions.
ProactiveAI unifies transaction data from a variety of systems, such as Shopify, WooCommerce, Lightspeed, Square, and leading ERP software, into a single analytics schema. Using AI’s unified POS + ecommerce self-service analytics layer, It also enables cross-channel comparisons without requiring custom engineering.
Wholesale Performance Tracking for Brand Manufacturers
For brands with a wholesale distribution network, it’s more difficult to gain visibility into performance.
You rely on retailer-generated sell-through data that often arrives at inconsistent intervals, in multiple formats, and with significant delays. This is the primary issue that wholesale performance tracking solutions aim to address.
A good wholesale analytics service should provide you with:
- Account health scoring: A composite score for each wholesale account based on sell-through velocity, reorder frequency, markdown exposure, and chargeback history.
- SKU-level attribution by account: Identify which products perform well across accounts and which create markdown risks.
- Automated partner data ingestion: Ingesting the partner data from the automated partner feed and transforming it to a consistent format and structure from any structure you sent them.
- Forward demand signals: Using trailing sell-through velocity to project forward replenishment needs before retail buyers place orders.
- Chargeback and compliance monitoring: Reduce margin loss on every wholesale order by flagging compliance violations.
How to Choose the Right Retail Analytics Platform?
Choosing the right retail data reporting tool or retail store analytics platform has become more important than ever before and bigger than ever. Here’s a checklist to check your options with your real needs:
| Capability | Generic BI Tools | Retail-Specific Platforms | ProactiveAI |
| Ready-made ecommerce KPI models | Build from scratch | Partial | Out of the box |
| The comparison of sell-in and sell-through figures | Manual | Limited | Automated |
| Door-level analysis | With a custom setup | Varies | Native |
| Make use of wholesale partner data ingestion | Engineering required | Limited connectors | Multi-format ingestion |
| POS + ecommerce unification | Complex ETL needed | Some integrations | Pre-built connectors |
| Omnichannel attribution | Not supported | Basic | Cross-channel model |
| The time for the first sight of the seedling/seedling phase | Weeks to months | Days to weeks | Hours to days |
When trying to compare retail analytics platforms, look for three non-negotiables: data freshness, breadth of integration, and retail-native modeling.
These capabilities can be further improved with a modern, AI-powered conversational analytics platform that empowers users to ask natural-language questions like “What stores require inventory adjustments this week?” and receive answers in real time.
Best Practices for Building a Retail Analytics Culture
Technology alone does not improve retail performance, and analytics platforms deliver ROI only when insights lead to action. Let’s take a look at the organizational practices that set analytics leaders and laggards apart when it comes to retail:
Establish a weekly performance cadence
A key set of retail KPIs should be monitored weekly, not monthly, by senior leadership. The quicker the feedback loop, the more responsive your operation is.
Establish metric ownership
Each KPI should have an owner who will report any deviations and help improve it. Metrics that don’t have owners are noise.
Start with three metrics, not thirty.
Too many metrics can be just as problematic as having too few. Locate your three most impactful (i.e., critical) performance measures, and develop a shared understanding of those measures as a team, before you expand.
Contextualize before escalating
A falling sell-through rate is troubling. Is it a demand issue, an inventory mix issue, or a pricing issue? Train staff to perform Root Cause Analysis before they escalate.
Close the loop with field teams.
The store manager and wholesale salespeople should have their own performance information, not just what is stored in a head office dashboard. Empowered field teams drive faster on-the-ground correction.
Why ProactiveAI is Built for Omnichannel Retail Intelligence?
ProactiveAI is native AI analytics for omnichannel brands with a DTC, wholesale, and marketplace presence. Unlike the generic BI tools, which take months to set up just right, we have pre-built retail analytics models that are available live within days of connecting your data sources.
Our retail analytics dashboard provides a single view of all KPIs, from chain-level metrics to individual stores and SKUs, to show what’s working and where attention is required.
We import retailer data in various formats and provide a simple and intuitive sell-in vs. sell-through view of all wholesale accounts with Automated Sell-Through Reconciliation.
Door-Level Performance Scorecards allow you to rank, compare, and analyze store performance with one-click drill-downs.
We consolidate data from your POS and ecommerce systems into a single normalized data set on Shopify, WooCommerce, Lightspeed, Square, and ERP.
Our wholesale account intelligence monitors account health, SKU velocity, and forward-demand predictions, while Automated Alerts and Anomaly Detection alert to performance threats in advance.
Conclusion
In today’s low-margin, high-expectation retail environment with increasingly complex sales channels, it is the brands that will win who will be able to make decisions with data faster and more precisely than their competitors. Retail store performance metrics are not a report but a strategic asset.
Omnichannel retail is too complex for retrofitted, generic BI tools. Whether you need to track sell-in versus sell-through across 200 wholesale doors, diagnose store-level conversion gaps, or reconcile POS data with eCommerce performance, you need a unified analytics platform. It must be retail-native and built specifically for the job.
ProactiveAI was created specifically to solve this problem, from sell-through automation to door-level performance scorecards and wholesale account intelligence. With us, omnichannel retail brands are set to have the clarity they need to act, not just report.
Frequently Asked Questions
What is retail store performance analytics?
Retail store performance analytics is used to compare the effectiveness of retail stores at turning inventory, employees, and marketing into profit. It integrates sales, inventory, and customer behavior analytics to yield actionable insights for operational and strategic decision-making.
What are the most important KPIs to track for retail store performance?
Some of the most important KPIs are sell-through rate, GMROI, inventory turnover, average transaction value, conversion rate, sales per square foot, and customer lifetime value. These metrics help in optimizing inventory, staffing, merchandising, and profitability.
What is the difference between sell-in and sell-through in retail analytics?
The sell-in data measures products delivered to retail partners, whereas the sell-through data measures sales to end consumers. Both enable proper inventory control, minimize markdowns, and accurately identify product demand in each store.
How do omnichannel brands analyze performance across multiple retail doors?
Omnichannel brands bring together online, offline, and wholesale data within a single dashboard. The data is reported at the door level and provides accurate and specific information about top performers, underperformers, stock levels, regional demand, and trends.
How can AI analytics improve retail store performance tracking?
AI analytics streamlines data integration, analyzes patterns, forecasts demand, and offers actionable insights. Retailers can make predictions, optimize inventory, tailor offers, and catch anomalies on the fly, all of which boost efficiency and profitability.
You might also like
Handpicked articles for your reading list.


Get the latest insights on Conversational AI
Stay ahead of the curve with weekly updates on data analytics, AI trends, and eCommerce growth strategies delivered straight to your inbox.
Join 5,000+ industry leaders. Zero spam, just pure insights.