
 SparxIT
 SPXCommerce
 What's Your A




eCommerce
eCommerce
eCommerce Gross Margin vs. Net Margin: How to Track Profitability at Every Level
-
Varun Kumar
- Jul 13, 2026
- 9 mins read
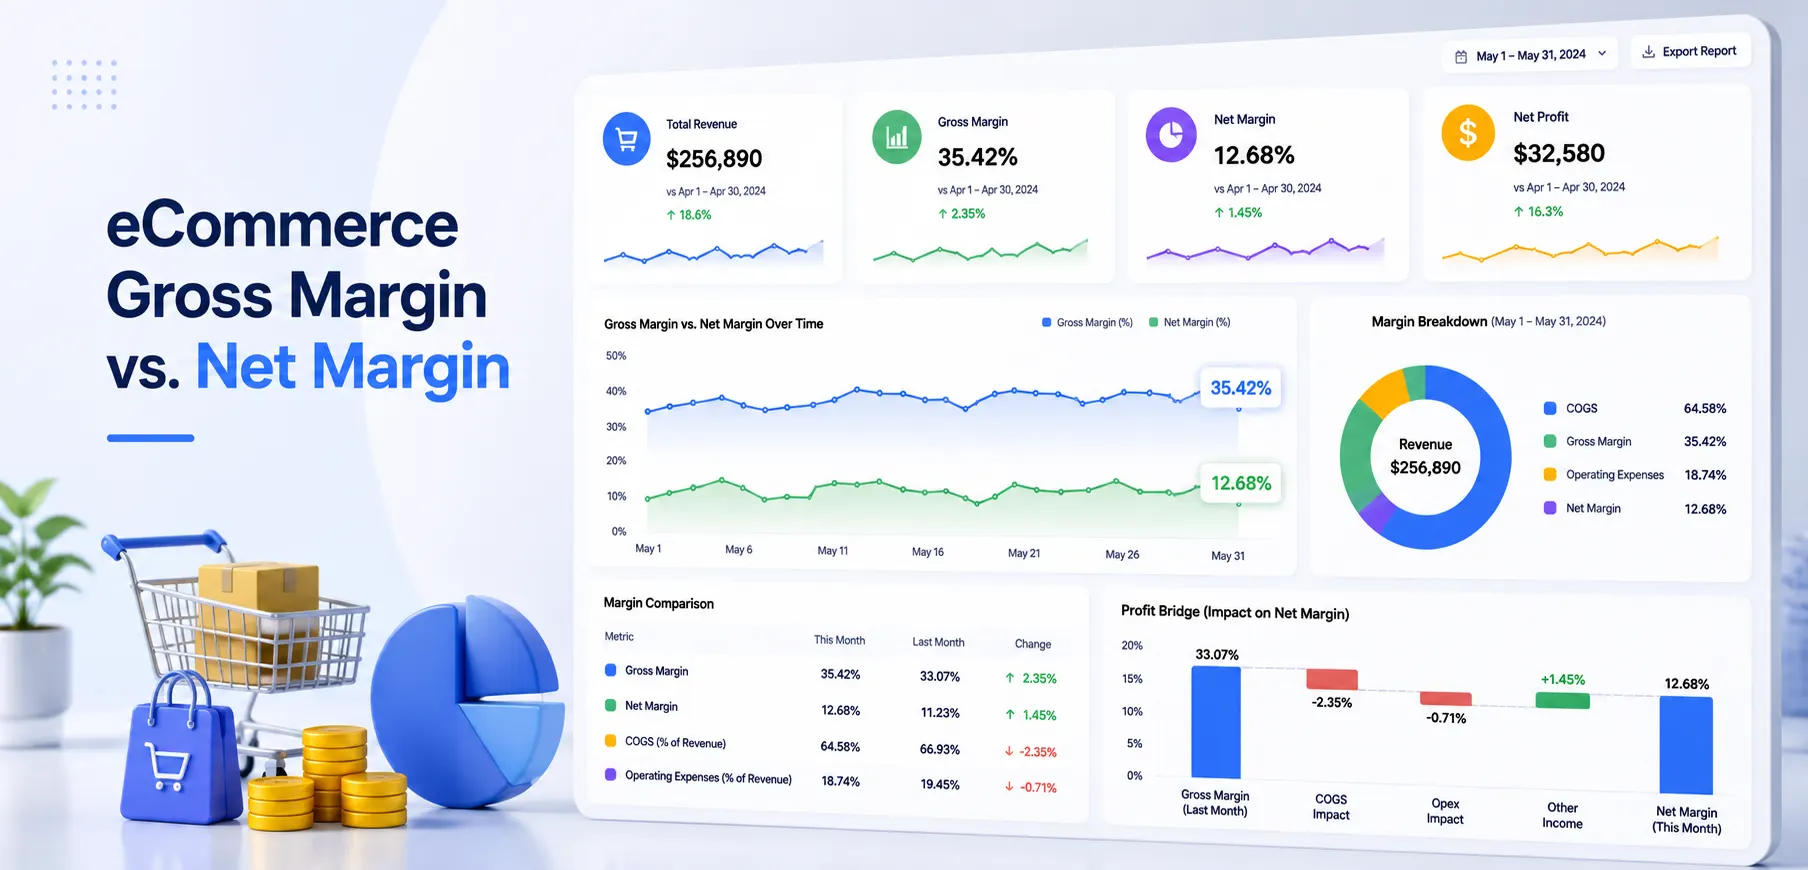
Revenue is growing, and order volumes are increasing, yet profitability often fails to keep pace. Many ecommerce businesses struggle to understand why higher sales do not translate into stronger financial performance.
This is one of the most common profitability challenges ecommerce businesses face. Brands invest in marketing, product development, and customer acquisition, but they don’t know which parts of their profits are being drained. They’re having a lot of fun, while the bottom line is slowly being eroded.
The root cause? Most eCommerce teams obsess over revenue but pay attention to margin only as an afterthought, or at the quarterly review stage. The reality is that there’s not a single measure of profitability. It exists at several levels, and knowing the eCommerce gross margin and net margin is the basis of any good financial plan.
Now, in this guide, you will discover exactly what each of these margins is measuring, why they are important on their own, how you can compare your numbers to industry standards, and how new solutions can help you track margins and make it continuous, intelligent, and actionable, not a monthly fire drill.
What is eCommerce Gross Margin?
Gross margin is the percentage of revenue that is not your Cost of Goods Sold (COGS). For eCommerce, COGS typically includes the cost of products produced or purchased, inbound shipping from suppliers, packaging costs, and any direct labor associated with manufacturing.
Formula:
Gross Margin (%) = [(Revenue – COGS) ÷ Revenue] × 100
Example: Your eCommerce business makes $500,000 per month, and your COGS are $300,000 per month; your gross margin is:
[($500,000 – $300,000) ÷ $500,000] × 100 = 40%
This figure measures how efficiently your products generate profit before operating expenses are deducted.
Ecommerce gross margin is the most basic indicator to help you decide whether your brand has enough room for marketing and investment, new hires, and technology while still making a profit.
What is Net Margin in eCommerce?
Net margin is the percentage of profitability after deducting all expenses from revenue, including platform fees, salaries, taxes, interest payments, returns, COGS, and operating expenses.
Formula:
Net Margin (%) = [Net Profit ÷ Revenue] × 100
Example: Suppose operating expenses, marketing, platform fees, and taxes are $180,000, and that’s on top of COGS, with the same revenue of $500,000. You have a net profit of $20,000, and so you have:
[$20,000 ÷ $500,000] × 100 = 4% net margin
Net margin reflects the overall profitability of your ecommerce business after all expenses are deducted. It provides answers to the most basic question: how much do we actually keep after all?
Gross margin measures product profitability, while net margin evaluates the overall sustainability of your business model.
The Difference between eCommerce Gross Margin vs. Net Margin
| Factor | Gross Margin | Net Margin |
| What it measures | The profit margin of products after COGS (Cost of Goods Sold). | True bottom-line profitability. |
| Expenses included | COGS only. | COGS plus all operating and non-operating expenses. |
| Use case | Evaluating product viability and informing pricing strategy. | Assessing overall business model health and investor reporting. |
| Typical eCommerce range | 30%–70% (varies by category). | 1%–10% (varies widely). |
| Affected by | Supplier costs, packaging, and inbound logistics. | Marketing expenses, payroll, taxes, platform fees, and other operating costs. |
| Frequency of review | Weekly or monthly. | Monthly or quarterly. |
Gross margin reflects product profitability, while net margin measures overall business performance. To build a sustainable eCommerce brand, both running and marketing are essential.
eCommerce Gross Margin Benchmarks by Industry
One of the most frequent questions founders ask is: “Is our margin good? It depends greatly on the category you are in. Here are some realistic gross margin eCommerce benchmarks by vertical:
| eCommerce Category | Average Gross Margin |
| Software / Digital Products | 70%–90% |
| Health & Beauty (DTC) | 50%–65% |
| Apparel & Fashion | 45%–60% |
| Home & Furniture | 35%–50% |
| Consumer Electronics | 20%–35% |
| Food & Beverage | 25%–40% |
| Pet Products | 40%–55% |
| Sports & Outdoors | 35%–50% |
Physical goods have an average DTC gross margin of 40% to 60%, and anything below 40% is a red flag for brands operating under pressure when accounting for operating costs. Nearly no fulfillment costs enable brands in the digital or subscription product category to achieve much wider margins for their sales.
When gross margin is less than 30%, there is little margin for error in investing in the business, absorbing profits, or coping with supply chain disruptions. Margin recovery is the top priority.
How COGS, Shipping, and Returns Affect eCommerce Gross Margin?
Gross margin in eCommerce is not likely to remain consistent. It is under constant pressure due to several variables that need to be handled with sharp COGS eCommerce Analytics.
1. Cost of Goods Sold (COGS)
COGS is the actual cost of your product or service, as it is manufactured or sourced. Your margin can be negatively impacted by a number of factors without your product’s price changing, such as rising material costs, supplier price increases, or a switch to premium packaging.
2. Outbound Shipping Costs
To be competitive, many brands include shipping in their “free shipping” offers. If fulfillment is included in COGS or treated as a line item subtracted from your gross margin, it can affect your actual gross margin per order.
3. Returns and Refunds
The eCommerce return rate varies from 15% to 40% across various product categories. Reverse logistics costs, repackaging costs, and even product write-offs are incurred with each return, not to mention the reverse logistics costs. High return rates directly reduce gross margin through reverse logistics, product write-offs, and additional handling costs.
4. Discounts and Promotions
Heavy discounting (BFCM flash sales, subscription-first order discounts) attracts lots of traffic but can lead to a drop in the gross margin percentage even as revenue increases. It’s a common pitfall that leads brands to think they are doing well, even as profits take a hit.
The takeaway: Gross margin is not a fixed figure. Monitor it on an order-by-order level, rather than at the monthly level.
Which channel is best for your business? Let’s check the margin.
Not all revenue yields are the same. One of the most insightful analyses a brand can perform is margin by channel, but most brands don’t do it consistently.
Here’s what the picture typically looks like:
- The Direct-to-Consumer (Website) Segment generates the highest gross margin. No marketplace fee, complete price control, and direct customer relationship. This is the standard of the best of the best.
- Amazon / Marketplace Channels: Referral fees (8%-15%), FBA fulfillment fees, and competitive pricing pressure all contribute to a severe margin squeeze. Amazon can be an extremely lucrative channel for brands, but it’s not as profitable as it seems.
- Wholesale/Retail Partnerships: Margin is shared with the retailer (typically 50% of the suggested retail price). There may be a lot of volume, but a thin profit margin per unit.
- Social Commerce (TikTok Shop, Instagram): Margins can be eaten up by insufficient organic reach and platform fees.
The strategic implication? Do not go for channel volume, go for channel margin. The $2M stream at a 15% margin translates to less than $800K at a 55% margin after all channel-specific costs are subtracted.
Not Every Best Seller Is Your Most Profitable Product
An eCommerce analysis of running margin by product can sometimes be like a wake-up call. Nearly every catalog has 20 to 30% of its SKUs contributing to 70-80% of its gross profit, and many of its products may be margin-negative after returns, discounts, and fulfillment expenses are allocated.
Steps to run a product-level margin analysis:
- Calculate true COGS per SKU: Including packaging, kitting, and inbound freight allocation
- Add fulfillment cost per unit: Pick, pack, and ship costs vary by size/weight
- Subtract average discount rate: What’s the actual average selling price?
- Factor in return rate per SKU: Some products return at 40%+
- Calculate the net contribution per unit
Products with a negative contribution margin or a contribution margin below 10% are “drag” items that consume inventory capital, fulfillment capacity, and customer service resources while contributing little or no profit.
The right approach: renegotiate supplier costs, reprice, bundle with high-margin items, or cut it. All products in your catalog should be justified.
How to Improve Your eCommerce Gross Margin?
Simply increasing prices is not always the best solution to improve ecommerce gross margin. These are the most powerful strategies:
1. Negotiate Supplier Pricing at Scale
Volume commitments, longer payment terms, and consolidated SKUs provide you with negotiating power. Reducing COGS improves gross margin, although the impact depends on your revenue and cost structure.
2. Reduce Return Rates
Take the time to invest in better product photos, comprehensive sizing guides, accurate descriptions, and post-purchase education. Each percentage-point gain in the return rate is a marginal loss.
3. Bundle Products Strategically
High-margin products with low-margin products that customers must buy boost average order value and blended gross margin.
4. Optimize Packaging
Right-sizing packaging will minimize dimensional weight charges and material costs without the customer ever knowing.
5. Control Promotional Depth
Maintain a viable margin floor by capping discounts as percentages. Automate rules to ensure that promotions do not run below a margin threshold.
6. Increase the Share of Revenue from DTC Channels
Every percentage point of revenue from marketplace to owned DTC channels makes a significant impact on blended gross margin.
How to Track eCommerce Profitability with ProactiveAI?
ProactiveAI’s ecommerce analytics dashboard brings gross margin, net margin, COGS breakdown, and channel-level profitability into a single, unified view. Instead of stitching together spreadsheets from your Shopify backend, ad platforms, and 3PL, your entire margin picture is automatically updated in real time as transactions, returns, and ad spend flow in.
You can drill from company-level gross margin down to channel margin, product-level margin, and even individual campaign profitability in seconds.
1. Real-Time eCommerce Analytics Dashboard
The ecommerce analytics dashboard enables businesses to monitor gross margin, net margin, COGS, and channel profitability in a single interface. Your entire margin picture is live and automatically updated as transactions, returns, and advertising spend occur.
It takes seconds to drill down from company-level gross margin to channel margin, product-level margin, and beyond to individual campaign profitability.
2. Conversational Analytics AI
The key ability of ProactiveAI is its conversational analytics AI layer. You can avoid creating reports and wait for your data analyst to run a query, and instead just ask: “Which product categories are dragging our gross margin this month?” or “How does our DTC margin compare to our Amazon margin over the past 90 days?”
The platform provides data-driven, easy-to-understand solutions that make margin intelligence accessible to everyone on your team, not just those with SQL or BI skills.
3. AI-Powered Margin Optimization
ProactiveAI’s intelligence layer constantly analyzes your COGS, pricing, discount depth, and fulfillment costs, detecting anomalies and opportunities before they become issues. If a supplier price change occurs, the system will proactively alert you to which SKUs are now below the margin floor, without you having to review them.
4. eCommerce Sales Forecasting
The platform combines historical analysis with predictive forecasting to help businesses manage future profitability. It has built-in ecommerce sales forecasting tools that can predict future margin performance from your current COGS trajectory, channel mix changes, and planned promotional calendars. This also allows your finance and operations teams to make decisions about inventory and staffing with the real margin visibility, not optimistic top-line projections.
5. Self-Service Business Intelligence
ProactiveAI has a self-service Business Intelligence architecture where your margin views are relevant to your merchandising, marketing, and finance teams, and don’t have to go through a central analytics team to make decisions. Margin is no longer just an item in the CFO’s model but a shared language throughout the organization.
Conclusion
Gross margin measures product profitability, while net margin reflects the overall financial health of the business. You have to be clear not only about these snapshots monthly, but also about the channel, product, and time.
It isn’t the highest revenue brands that win in eCommerce. The most successful ecommerce brands understand where profit is generated, where it is lost, and how to improve it in real time. It’s not enough to have a spreadsheet. It needs intelligent, automated, real-time ecommerce profitability tracking that’s in the flow of your business.
ProactiveAI is designed for just that. If you’re looking to uncover your P&L’s margin eaters, see if one sales channel is performing better than another, or predict what impact a price change will have on your P&L, ProactiveAI provides real-time, AI-driven profitability insights that help businesses make faster and more informed decisions.
Frequently Asked Questions
What is gross margin in eCommerce, and how is it calculated?
In the eCommerce business, Gross Margin is the percentage of revenue remaining after deducting the Cost of Goods Sold (COGS). It’s calculated as: [(Revenue – COGS) ÷ Revenue] × 100. It reflects the profitability of products before operating costs, such as marketing or salaries, are included.
What is a good gross margin for a DTC eCommerce brand?
The average of a healthy DTC gross margin is generally between 40-60% for physical goods. Anything under 35% will need to work hard to cover the costs of running their business, and if the product is digital or subscription-based, it can easily reach 70%+ because there is little fulfillment cost.
How is gross margin different from net margin in eCommerce?
Only the cost of goods sold (COGS) is deducted from revenue to show product viability, and this is called gross margin. Net margin in eCommerce subtracts all costs, including COGS, marketing, salaries, platform fees, and taxes, to show you your true bottom-line profitability. While both are helpful, they address different questions or issues.
Which channels typically have the best and worst gross margins?
Generally, the highest gross margins are achieved through direct-to-consumer (DTC) channels, where marketplaces do not take a cut of profits and the price is under the seller’s control. Amazon and retail wholesale channels are usually the least profitable because of referral fees, fulfillment costs, and the need to accept lower prices.
How do COGS, shipping, and returns affect eCommerce gross margin?
All three negatively affect gross margin. The supplier’s higher COGS affects the margin at the source. The cost of absorbed shipping reduces the effective revenue per order. Returns bring about reverse logistics costs and inventory write-offs. When revenues are steady, they can work together to quietly squeeze out the margin.
You might also like
Handpicked articles for your reading list.


Get the latest insights on Conversational AI
Stay ahead of the curve with weekly updates on data analytics, AI trends, and eCommerce growth strategies delivered straight to your inbox.
Join 5,000+ industry leaders. Zero spam, just pure insights.