
 SparxIT
 SPXCommerce
 What's Your A

AI & Analytics
AI & Analytics
Shopify Analytics: The Complete Guide to Understanding Your Store Data
-
Varun Kumar
- Jul 31, 2026
- 10 mins read
Your Shopify store is generating sales, you’re getting visitors regularly, and your business is thriving. However, when it comes time to figure out where to beef up marketing budgets, which products to devote more inventory to, and which customers to target, the answers are not always clear-cut. Having data isn’t the same as knowing what to do with it.
It’s the main issue that most Shopify merchants encounter. The data is there. You get a surprisingly extensive reporting layer straight out of the box from Shopify. The problem is understanding what each report signifies, which metrics truly impact decision-making, and when the built-in dashboard is insufficient.
This guide covers all that and every important area of the Shopify analytics dashboard that shopify reports check, when, how, and where Shopify’s data compares with Google Analytics, and how native Shopify reports fall short of modern AI analytics tools, such as ProactiveAI.
What Is Shopify Analytics?
Shopify Analytics is the most basic analytics platform, integrated into every Shopify store, from the smallest Basic plan to the largest Shopify Plus plan. It provides you with current and past data on your store’s sales, traffic, customers, and marketing efforts, without relying on a third-party application.
Shopify’s studies indicate that retail business owners who routinely review store data are 2x as likely to exceed their earnings goals as those who rely on hunches. However, the majority of store owners still just look at total sales and go on to the next thing.
The native Shopify data analytics layer has four main components:
- The Overview Dashboard for headline metrics
- Reports Library with deep dives by category
- Live View for real-time activity
- The ShopifyQL feature (Available on Advanced and Plus plans) allows custom queries.
The difference among Shopify Plans isn’t about having access to data, but about how deeply you can go into it. Basic stores will receive core sales and traffic views. Cohort analysis, behavior reports, and custom reporting are available on Advanced and Plus. The same 1st party order data is available at all levels.
What Does the Shopify Analytics Dashboard Show?
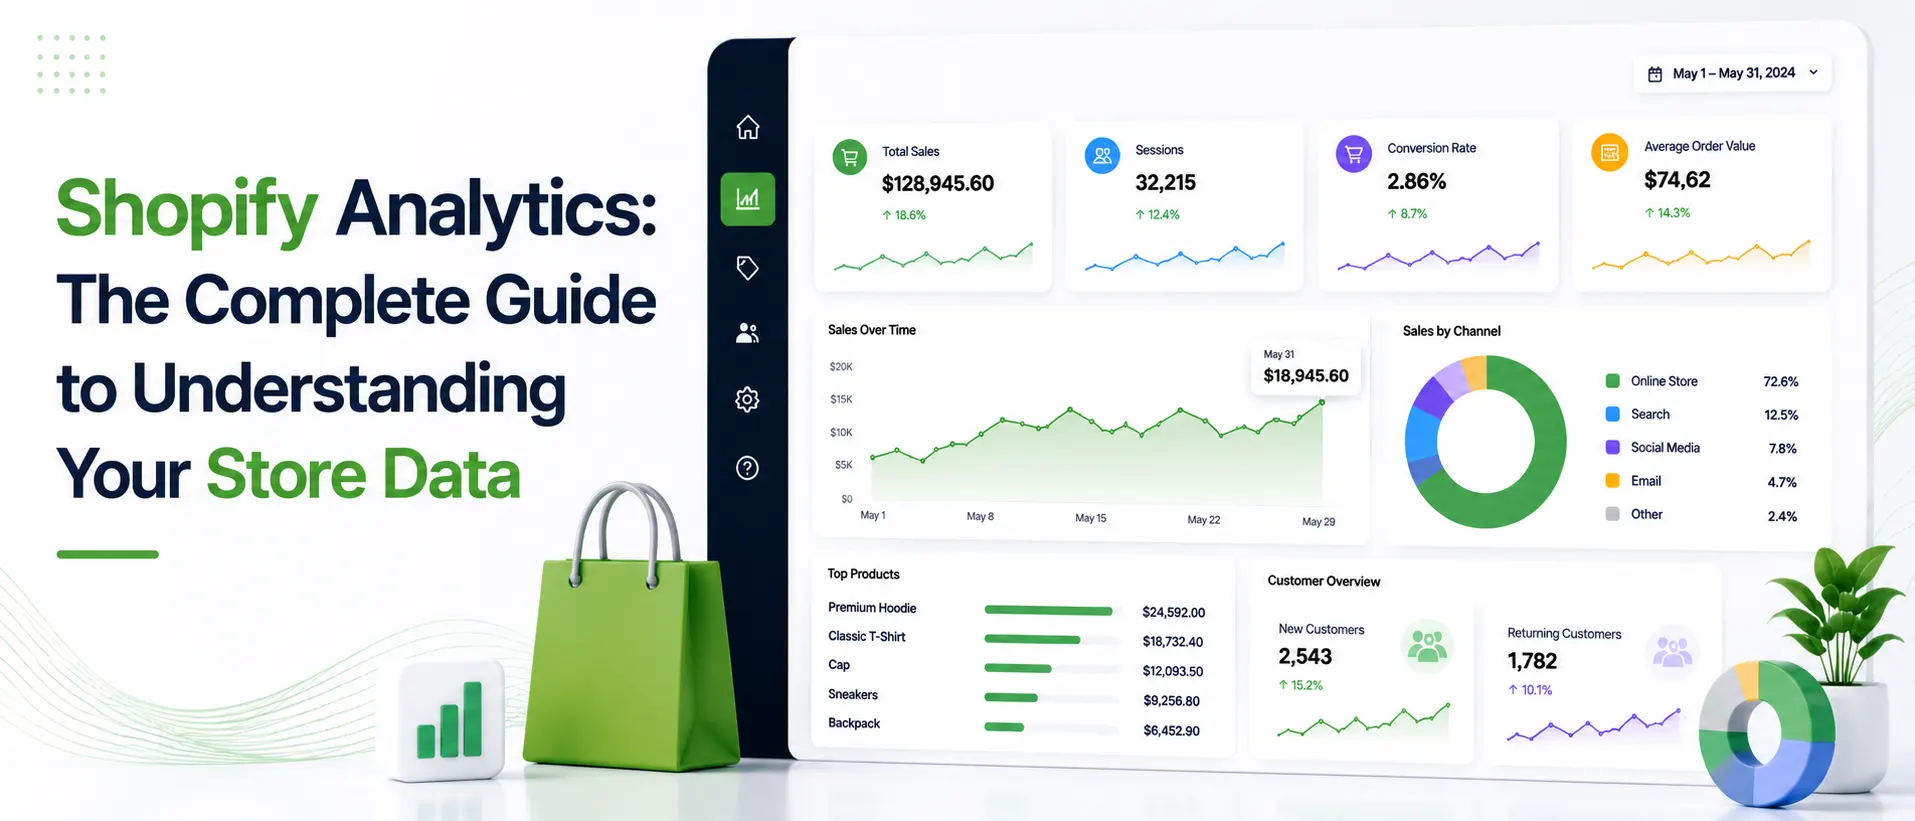
Shopify Analytics is the home page of your store’s performance dashboard. It’s written to be read every day. What you’ll discover:
The Overview Dashboard provides a quick overview of core metrics.
| Metric | What It Tells You |
| Total Sales | The total revenue earned from orders after refunds and discounts are deducted. |
| Online Store Sessions | The total number of visits to your online storefront during the selected time period. |
| Conversion Rate | The percentage of store sessions that resulted in a completed purchase. |
| Average Order Value (AOV) | The average amount spent per order, calculated as Total Revenue ÷ Number of Orders. |
| Returning Customer Rate | The percentage of orders placed by customers who have made previous purchases. |
| Top Products by Units Sold | The products that sold the highest number of units during the selected time frame. |
You can specify a time range and compare it to other periods using the dashboard, making it easy to track trends on a week-over-week or month-over-month basis.
Live View
With Live View, you will get real-time data on orders, active visitors, and visitor location on a map. It’s truly helpful in a flash sale or product launch. This is not an analysis tool but rather a pulse check.
The Limitation Worth Knowing
The Overview dashboard provides information about what has occurred in your Shopify store. Does not reveal anything about the cost of generating that traffic via Meta, Google, or TikTok. You can see the result but not the expense in creating it. This is the place where a self-service analytics layer is valuable.
Shopify Reports Explained: What’s Inside Each Section?
Shopify data analytics becomes specific when it comes to the Reports Library. There are unique questions for each category.
1. Sales Report
Shopify sales reports provide a breakdown of sales by product, variant, channel, and time period. Gross sales, discounts, returns, and net sales (the one that’s relevant for your P&L) will be visible, and you can filter by sales channel to separate your online sales from your POS or other integrations.
2. Acquisition Reports
These reports combine sessions into four categories: direct, organic search, paid search, email, social, and referral. They inform you of the sources that are generating volume. They won’t be able to tell you because they can’t say where that volume is coming from, and ad spend isn’t a factor in this.
3. Behavior Reports
Behavior reports analyze session duration, on-site search queries, conversion funnel metrics, and drop-off rates. It is also used to diagnose the issue if you are getting traffic and low conversions.
4. Shopify Customer Reports
Customer reports can be used to segment customers into first-time buyers and returning customers, identify customers likely to churn, and view purchase frequency. On Advanced and Plus plans, you will also have cohort analysis, which segments customers by the month they first purchased and monitors their spending habits over time.
5. Marketing Reports
Marketing reports credit sessions and orders to the last campaign a user clicks on before adding an item to their cart or converting to an order. They are helpful to see where traffic is coming from. The attribution model is easy and last-touch, which is more of a direction than a final step.
6. Finance Reports
Financial reports reconcile payments, taxes, refunds, and Shopify payouts. They’re the facts and figures for your accountant, and it’s the same as Shopify presents it to you and your bank.
7. Shopify Traffic Analytics
Shopify traffic analytics (found in Acquisition and Behavior) provides you with a breakdown of sessions, a channel breakdown, and a basic geographic overview of where your visitors are coming from. It is very solid at identifying traffic trends but not so good at understanding the “why”.
Which Shopify Metrics Should You Actually Track?
Not all metrics are worth your daily attention. Here’s a practical framework:
Daily
- Total sessions vs. prior period
- Conversion rate (flag drops immediately)
- Total sales vs. daily target
Weekly
- AOV trends by channel
- Top 10 products by revenue
- Returning customer rate
- Cart abandonment rate
Monthly
- Cohort retention and LTV by acquisition source
- Channel-level revenue contribution
- Customer acquisition trends (new vs. returning split)
- Refund rate by product
There are not too many significant differences in the shopify metrics to track from month to month, and it’s what they’re compared to that varies. A 2.5% conversion rate isn’t meaningful without context for comparison. It tells a story when compared to the performance of the same month last year, the same quarter last year, and your category benchmark.
Shopify Analytics vs Google Analytics
This comparison is always thrown around, and the truth is, they’re asking different questions. Both should be used by most growing stores.
| Dimension | Shopify Analytics | Google Analytics 4 |
| Core purpose | Order and revenue reporting | Web traffic and behavior |
| Data source | Your first-party order data | Browser-based, modeled sessions |
| Ecommerce metrics | Built-in natively | Requires configuration |
| Attribution model | Last-click within Shopify | Data-driven + last-click options |
| Transaction accuracy | Matches real orders | Often undercounts (cookies, blockers) |
| Learning curve | Low | Steep |
| Cost | Free with your plan | Free (GA4 360 is paid) |
The most significant real-world distinction is that Shopify Analytics is accurate regarding orders. GA4 often undercounts transactions because cookies can expire or fail to be set in privacy-restricted modes, such as incognito windows, which prevent browser-based tracking. If your GA4 shows 200 orders but your Shopify shows 240, you should trust Shopify.
Get insights from GA4 into customer behavior before they purchase. Know what and who they bought after using Shopify analytics. However, if you want a unified view without manual effort, that’s where an ecommerce analytics platform such as ProactiveAI comes in handy.
How Does Shopify Conversion Tracking Actually Work?
Shopify conversion tracking counts a conversion as when a visitor makes a purchase on your store. Your conversion rate in your dashboard is calculated as:
Conversion Rate = (Orders ÷ Sessions) × 100
There are a couple of things to be aware of when it comes to counting this:
- One visitor can create several sessions during their purchase pathway. Shopify does NOT measure unique visitors in the denominator.
- The Shopify conversion funnel (in Behavior reports on higher plans) indicates the various drop-off points: landing page → product page → cart → checkout → order.
- Shopify can’t natively track cross-device journeys. When a user is browsing on mobile and then clicks to purchase on desktop, it appears as two sessions.
It’s crucial for stores with paid ads. But the customer journey that you see in reality isn’t exactly as simple as Shopify’s customer session. Shopify conversion tracking is accurate during a customer’s session. It’s a structurally different problem and not a true cross channel/multi-touch attribution.
How Do You Track Customer Lifetime Value in Shopify?
Customer lifetime value (LTV) is available in Shopify within the Customers section or, more significantly, via cohort analysis on Advanced and Plus plans.
Native Shopify customer reports provide you with the following:
- The total amount spent by each customer.
- The number of orders placed by customers.
- How many days since the last order?
- New flag vs. repeat flag
- Customers not purchased in X days
The “cohort view” for Advanced/Plus shows the spend of each customer cohort over the next few months. It’s a very useful tool for understanding retention curves for both one-time and repeat buyers.
Where It Falls Short
There are two components missing for native LTV tracking in Shopify. First, it only registers revenue from Shopify and not from any other source. However, if you also sell on Amazon and/or in a wholesale channel or POS, those sales are not linked to the same customer profile. Secondly, it fails to tell you which channel acquired your highest-LTV customers the one piece of information that should influence where you spend your marketing budget.
This is the type of question where conversational AI analytics comes into play. You can use tools such as ProactiveAI to make a natural-language query, such as “Which channel has customers with a 12-month LTV greater than $300?”, and receive a structured response, without having to export CSVs and manually create pivot tables.
Where Shopify Analytics Falls Short?
Shopify Analytics is great in its own right. There it ends the scope:
1. No Blended CAC Across Channels
Shopify can provide you with the number of sales per channel. It won’t be able to tell you what it cost you to earn that income through each channel. To calculate true customer acquisition cost from Meta, Google, and TikTok, you need to manually download spend data from each platform and then merge it with order data from Shopify, or find a tool that can do this for you.
2. Last-Click Attribution Only
All attribution signals in Shopify’s built-in reports are last-touch. A Google ad, followed by an email click and then a conversion, will get the credit for the retargeting ad. The touchpoints that formed the intent can be invisible, in an upstream position.
3. Cross-Channel Identity Gaps
A customer who purchases from your DTC store but subsequently purchases on a marketplace is treated as two separate customers in Shopify. To achieve true LTV modeling, identity stitching is required across surfaces.
4. No Revenue Forecasting
Native Shopify reports are historical. No integration with ecommerce sales forecasting, so no idea of what to expect in sales next month or next quarter based on the trends. This is where predictive analytics tools for sales can come in very handy.
5. No Natural Language Querying
All Shopify reports are already created. To answer a question that is not in a report format, you can use ShopifyQL (Advanced/Plus only, requires query skills) or export the data and use a spreadsheet. That is the time that most teams have to wait for when the answers come along, and by then it’s too late to do anything about them.
Choosing a Shopify Analytics Tool or Alternative
Shopify’s built-in analytics provide all the essentials, but as stores grow, they will require more data depth and granularity than Shopify offers. A dedicated Shopify analytics tool can be helpful if you’re looking to tie in marketing performance with store data, predict sales revenue, or pinpoint your top customers.
One of those solutions is ProactiveAI, which is geared towards ecommerce teams. It enables users to ask questions in plain English rather than construct reports from scratch in SQL or with spreadsheet tools, and provides users with their analytics without requiring SQL or spreadsheets.
It also integrates Shopify order data with advertising spend to create channel-blended CAC and ROAS. In addition to historical reporting, ProactiveAI’s AI-powered forecasting capabilities forecast future sales patterns, aiding teams in more efficient inventory and budget planning.
It also links acquisition sources to customer lifetime value to identify the channels that lead to greater long-term profitability. ProactiveAI provides automated insights and highlights anomalies, helping you make faster, data-driven decisions without constantly checking multiple dashboards.
Conclusion
Shopify Analytics gives merchants a strong foundation for understanding store performance. From tracking sales, traffic, customer behavior, and conversion rates to monitoring retention and product performance, its built-in reports provide the essential insights needed to make informed business decisions. When reviewed consistently, these metrics help identify trends, optimize marketing efforts, and improve the overall customer experience.
However, as an ecommerce business scales, historical reporting alone is no longer enough. Modern brands need deeper visibility into customer acquisition costs, cross-channel performance, lifetime value, forecasting, and multi-touch attribution areas where Shopify’s native analytics have limitations.
The most effective approach is to use Shopify Analytics as your source of truth for store and order data while complementing it with advanced analytics tools that connect marketing, customer, and financial data into a single view. This enables faster, more accurate decision-making without relying on manual exports or complex spreadsheets.
Ultimately, analytics should do more than report what happened, and they should explain why it happened and help you decide what to do next. By combining Shopify’s built-in reporting with AI-powered analytics platforms like ProactiveAI, merchants can move beyond dashboards and turn data into actionable strategies that drive sustainable ecommerce growth.
Frequently Asked Questions
What analytics does Shopify provide natively?
All built-in Shopify analytics, including sales reports, traffic acquisition, customer behavior, marketing attribution (last-click), financial reconciliation, and cohort analysis, are available in your store admin and included on any Shopify Advanced or Plus plan at no additional cost.
How do you connect Shopify to a BI tool for deeper analytics?
There are a few ways to integrate Shopify with a BI tool, such as using Shopify’s API, data connectors, or an app that automatically syncs your store data, like ProactiveAI. In most cases, you need to map Shopify’s data schema to your reporting layer for BI integrations.
What is the difference between Shopify Analytics and Google Analytics?
Shopify Analytics is built on your first-party data from your store, so it is very accurate for order, revenue, and customer data. Google Analytics is a web analytics tool that primarily tracks website behavior and traffic patterns, but may not accurately reflect actual sales as compared to Shopify’s sales data.
Which Shopify reports should I check daily vs. monthly?
Check sessions, conversion rate, and daily sales every day. Review cohort retention, LTV by channel, acquisition source trends, and refund rates monthly. These are strategic metrics that require a longer time horizon to be meaningful.
How do you track customer lifetime value inside Shopify?
Shopify tracks LTV through the Customers section and cohort reports (Advanced/Plus plans), showing total spend and order history per customer. For LTV broken down by acquisition channel or cross-platform behavior, you’ll need a tool like ProactiveAI that cross-references purchase history with traffic source data.
You might also like
Handpicked articles for your reading list.
Get the latest insights on Conversational AI
Stay ahead of the curve with weekly updates on data analytics, AI trends, and eCommerce growth strategies delivered straight to your inbox.
Join 5,000+ industry leaders. Zero spam, just pure insights.