
 SparxIT
 SPXCommerce
 What's Your A


AI & Analytics
AI & Analytics
Best No-Code Analytics Tools for Non-Technical Teams (2026 Guide)
-
Vikash Sharma
- Sep 14, 2026
- 12 mins read
Your marketing manager has asked you why the last marketing campaign didn’t go as well as hoped, and your sales director needs to know which area isn’t hitting its goals. Meanwhile, operations need visibility into fulfillment delays. Everyone needs answers, and nobody has time to write a SQL query or wait 3 days for an IT report.
Most non-technical teams are just like this today. There is a lot of data, and access to it is one of the biggest issues. Many traditional BI workflows still require technical knowledge to model data, build dashboards, or write queries, which can create friction for non-technical users. That divide can have serious repercussions, from delayed decisions and lost opportunities to a reliance on an overburdened data team.
Modern no-code analytics tools can reduce the technical barriers that often prevent business users from accessing and analyzing da. No technical hoops for you to jump through, but they eliminate the coding knowledge requirement and allow anyone from a marketer to an account manager to a product lead to get answers. This leads to quicker decisions, broader data use, and a staff that can actually do something with the numbers telling them.
This guide lists the best no-code analytics tools for 2026, shares tips on choosing the right tool, and discusses how platforms like ProactiveAI are revolutionizing non-technical teams’ capabilities.
What Are No-Code Analytics Tools?
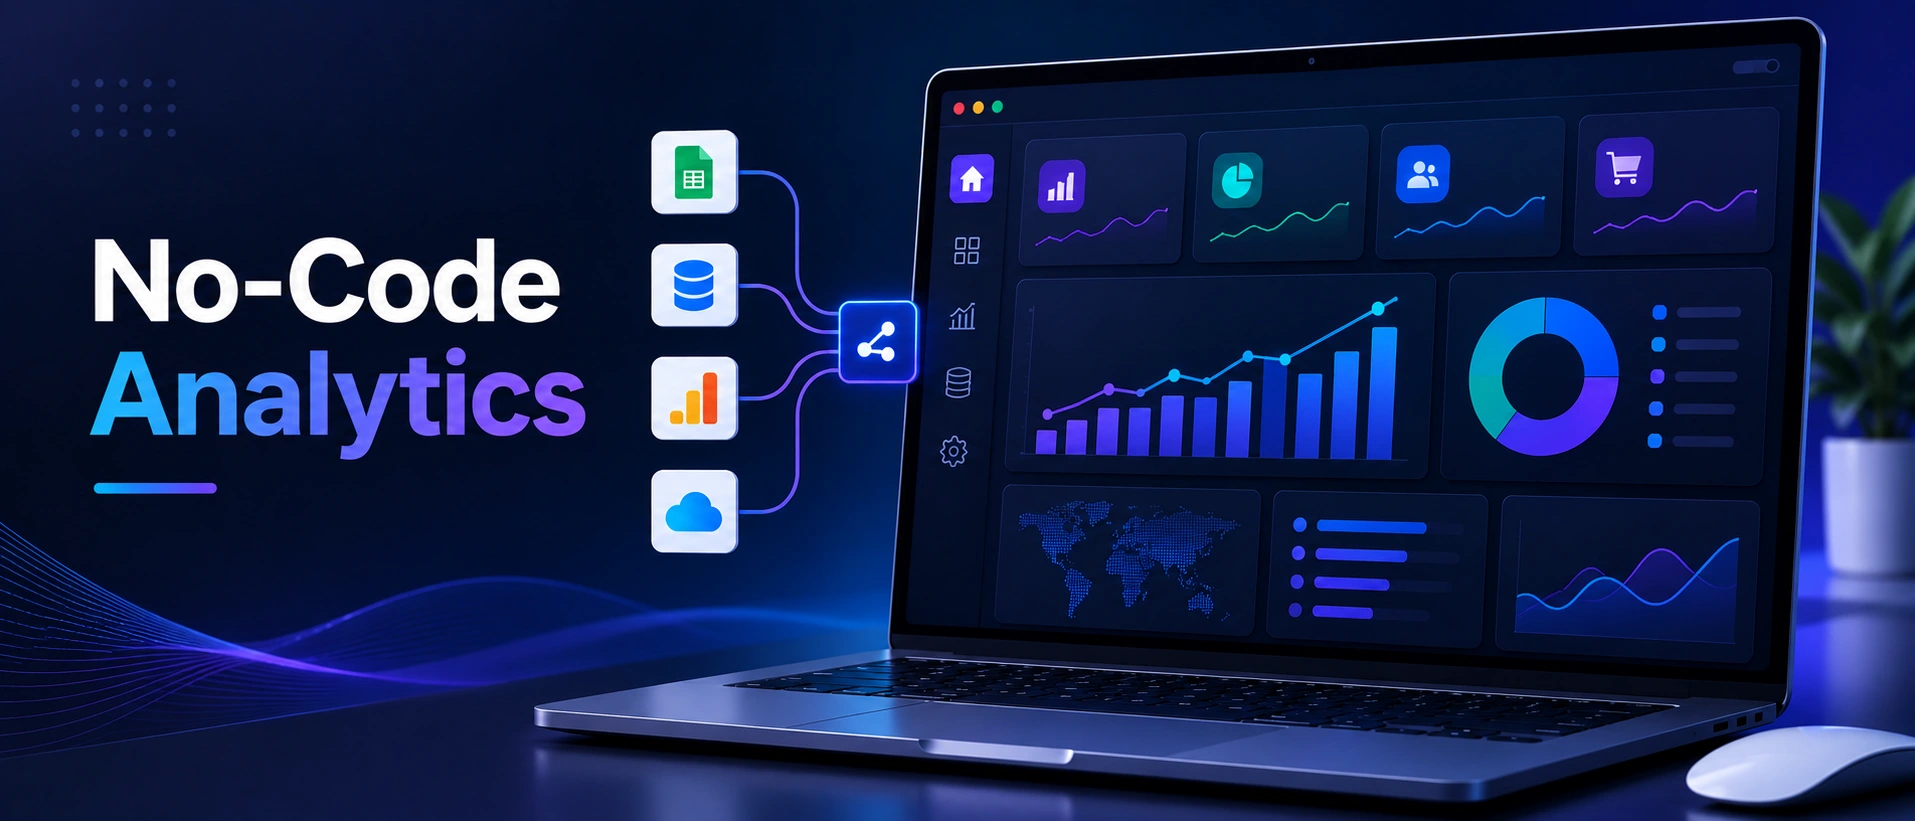
No-code analytics tools are platforms that allow users to gather, visualize, and interpret data without coding. Users work in drag-and-drop interfaces, use natural language prompts, or select prebuilt templates, rather than writing SQL queries, Python scripts, or complex dashboard configurations.
The category has become very well developed. The global self-service BI market is expected to grow at a CAGR of 11.3%, reaching $27.32 billion by 2032, as business users (not only analysts) will want data access in their hands, a 2025 industry report says.
In simple terms, no-code analytics layers are as follows:
- Data connection layer connects with various data sources (CRM, ERPs, spreadsheets, databases, APIs)
- Processing layer aggregates, cleans, and structures data for analysis
- Visualization layer generates charts, dashboards, and reports based on that data
- The most sophisticated tools, the insight layer, go a step further, presenting anomalies, predictions, and explanations automatically.
The distinction between a simple no-code solution and a high-end one typically relates to the extent to which that final layer takes care of itself.
What Separates a Good No-Code Tool from a Great One?
Not all “no-code” tools are equally user-friendly. Before you invest time in any of the available platforms, it helps to understand a few practical differences.
- Level 1 tools provide a visual interface with drag-and-drop charts and clickable filters. Even with this knowledge, you still need to understand your data structure and know which fields matter. Power BI and Tableau offer extensive self-service capabilities, but using them effectively still requires knowledge of data modeling, metrics, and visualization.
- Level 2 Tools include pre-built templates and guided setup. Fewer technical hassles, but you’re still operating off a pre-made report library, not asking questions.
- Level 3 tools can answer natural language queries, meaning that you can ask a question in natural language and receive an answer displayed in a chart. This is true self-service business intelligence. Natural-language interfaces can reduce the training required to perform common analytics tasks, although users still need a basic understanding of their data and metrics.
- Level 4 tools go one step further and identify insights for you without being asked. The platforms notify you of any anomalies, identify poor performance, and provide automatic narrative summaries.
If you’re a truly non-technical team, Level 3 and Level 4 options will matter most. It’s not just about a tool you can use without code, but it’s about a tool people will use when they have no interest in learning a new interface.
What Are the Main Types of No-Code Analytics Tools?
There are various use cases in the no-code analytics market. The right type depends on the questions your team is trying to answer.
1. Business Intelligence (BI) Platforms
They are comprehensive analytics solutions that enable teams to monitor KPIs, create dashboards, and analyze and report on performance across functions. They’re generally linked to multiple data sources and are suitable for cross-departmental use. This includes Looker Studio and ProactiveAI tools.
2. Product Analytics Tools
These tools focus on user behavior inside digital products: tracking events, funnels, retention, and cohort performance. Mixpanel and Amplitude are designed for product and growth teams who have questions such as “where are my users dropping off?”
3. Website and UX Analytics Tools
They provide a visual representation of user interaction on a website, including heatmaps, session recordings, and scroll tracking. The most widely known tool in this category is Hotjar.
4. Conversational AI Analytics Platforms
It is the fastest-growing and newest segment. These tools let users ask questions in natural language, almost as if a knowledgeable colleague were in the analytics engine. This is where conversational AI analytics comes in. You pose a question, the platform understands you, asks your data, and then gives you an answer.
5. Predictive Analytics Tools
They help to leverage AutoML and machine learning models behind a no-code user interface to predict outcomes like sales, demand, and churn. They are mushrooming in popularity because teams are discovering that it’s less useful to know what has happened than to know what is likely to happen next.
Which are the Best No-Code Analytics Tools in 2026?
The best no-code analytics tools in 2026 make it easy to turn complex data into actionable insights without writing a single line of code. From dashboards and reporting to customer analytics, these platforms help teams make faster, data-driven decisions.
1. ProactiveAI
ProactiveAI is an AI-based analytics platform designed for teams that don’t need to get bogged down in technicalities to gain understanding. Users can converse with their data, asking questions in natural language and getting responses in the form of charts, summaries, and recommendations, instead of building dashboards by hand or submitting tickets to a data team.
Key capabilities:
- Natural language querying: ask a business question and receive an answer directly from your data.
- Automated AI dashboard generation: link your data sources, and related dashboards will be automatically generated.
- Predictive Analytics: ProactiveAI’s AI sales forecasting feature enables users to forecast future sales and uncover demand trends without manually building forecasting models.
- Anomaly detection: the platform alerts you to unusual fluctuations in your metrics that can become more serious issues.
- Multi-source integrations: connects to CRMs, eCommerce platforms, ERPs, spreadsheets, and databases with minimal setup
- Scheduled reports and alerts: key metrics automatically delivered to stakeholders with no one having to pull data manually from the other person’s reporting system.
One unique capability of ProactiveAI is its self-service analytics model, which is ideal for non-technical teams. Any team member, whether they are a salesperson, a marketer, an operations person, or a finance person, can ask questions and receive answers without being familiar with data engineering or query languages. It can reduce the time required to answer routine business questions by allowing users to query data directly.
Additionally, ProactiveAI can support ecommerce analytics use cases by giving teams a single connected view of ecommerce conversion, customer behavior, and revenue performance.
2. Google Looker Studio
Looker Studio, formerly known as Google Data Studio, is a free, browser-based reporting tool that uses community connectors to connect to Google Analytics, Google Ads, Google Sheets, and many other third-party sources.
Key Capabilities
- Integrates Google Analytics, Google Ads, Google Sheets, and third-party data sources.
- Creates interactive dashboards and visual reports.
- Provides a variety of charts, graphs, tables, and scorecards.
- Supports data blending from several data sources.
- Allows report users to use filters and interactive controls.
- Allows real-time or scheduled data refreshes, depending on the connector.
- Enables simple report sharing and collaboration.
- Supports custom calculated fields and metrics.
- Runs in the browser without software.
- Works seamlessly with the rest of the Google universe.
Weaknesses: Advanced use cases may require technical configuration, connector limitations can affect data freshness, and the platform is particularly well suited to teams already using Google’s ecosystem.
Restrictions: Custom data sources may need a little technical work. The interface is visual but not conversational, so you still create reports rather than ask questions.
Ideal for: Smaller teams that have data in Google’s tools and want to share visual, readable reports without any budget.
3. Microsoft Power BI
Power BI is Microsoft’s leading business intelligence (BI) platform. It provides enterprise-level reporting, hundreds of data connectors, and rich integration with the Microsoft 365 stack. Q&A is a nice extra that adds natural language functionality, but it needs careful data models to be effective.
Key Capabilities
- Integrates with hundreds of data sources and databases.
- Creates interactive dashboards, reports, and visualizations.
- Uses advanced data modeling and transformation in Power Query.
- Can write complex calculations and measures using DAX.
- Supports natural language queries of data.
- Enables AI-driven insights and analytics.
- Provides drill-down, filtering, and cross-report exploration.
- Excellent integration with Microsoft 365, Excel, Azure, and Teams.
- Covers enterprise-level reporting and control.
- Makes it possible to share all reports with teams and organizations.
Weaknesses: Less robust for organizations not on the Microsoft infrastructure, smaller user base, steep learning curve.
Limitations: A steep learning curve. The formula language (DAX) and Power Query are very technical. Non-technical users are sometimes stumped without guidance. Per-seat pricing can add up quickly.
Ideal for: Businesses with a BI team to support the back end and business users to support the front end.
4. Mixpanel
Mixpanel is an event-tracking, funnel, and cohort-analysis-focused product analytics tool. Its no-code event setup lets product and marketing teams track user behavior without waiting for engineering help, and the visual query builder creates analysis through clicks instead of coding.
Key Capabilities
- Tracks user events and digital product interactions.
- Provides funnel analysis to identify conversion and drop-off points.
- Enables cohort analysis to group and compare users.
- Offers retention analysis to comprehend repeat usage.
- Provides live product analytics.
- Useful visual/no-code query builder.
- Allows user journey and behavioral analysis.
- Supports Custom Events and User Properties.
- Produces interactive dashboards and reports.
- Encourages product and growth teams to recognize engagement and conversion patterns.
Weaknesses: Limited integration with other features; opportunities to improve integration with other features. Real-time event data, robust retention analysis.
Limitations: Not designed for general business analytics, but it’s product-specific. This is also restricted to sales, financial, or operational applications.
Best for: Product managers or growth teams looking to better understand user behavior and interactions in a digital product.
5. Hotjar
Hotjar is an analytics tool that combines analytics with UX research. It also records heatmaps indicating where users click, session recordings of user visits, and in-page feedback polls. There’s virtually no learning curve; the setup is a single snippet of code, and everything after that is visual.
Key Capabilities
- Create website heat maps, including clicks, taps, and scrolling.
- Records real user visits in sessions.
- Gathers in-page feedback and surveys of users.
- Supports defining UX issues and bottlenecks.
- Records user activity on particular pages and components of a site.
- Gives users visual feedback on user behavior.
- Facilitates conversion and optimization for usability.
- Minimal technical setup with a website tracking snippet.
- In addition to traditional analytics, helps teams understand why users do what they do.
- Incorporates user feedback with behavioral analytics.
Strengths: Extremely easy to use, fast to deploy, genuinely useful for understanding on-site behavior.
Limitations: This is a website UX analytics tool, not a business performance analytics.
Ideal for: Marketing and UX teams looking to enhance conversion and user experience on their websites.
6. Amplitude
Amplitude is a step up from Mixpanel in complexity and sophistication. It provides user journey mapping, cohort analysis, predictive retention analytics, and a customizable dashboard layer. It has a Compass feature that identifies behaviors correlated with retention without requiring a data scientist to set it up.
Key Capabilities
- Monitors product events and user behavior.
- Provides funnel and conversion analysis.
- Provides sophisticated cohort and segmentation analysis capabilities.
- Provides user journey mapping.
- Performs retention analysis and predictive retention insights.
- Identifies user retention-relevant behaviors using Compass.
- Capable of predictive and behavioral analytics.
- Provides customizable dashboards and reporting.
- Allows product engagement and feature analytics.
- Supports product teams in making data-informed decisions without requiring extensive data-science expertise.
Strengths: Depth of behavioral analytics, strong predictive features, good for larger product teams.
Limitations: The learning curve isn’t steep, but it requires investment in setup and training for Amplitude to deliver full value.
Ideal for: medium to large product teams that require in-depth analysis and some predictability.
How Do These No-Code Analytics Tools Compare?
No-code analytics tools differ in their features, ease of use, integrations, and ability to support advanced analysis. Comparing these factors helps you choose the right tool based on your team’s needs, data maturity, and analytics goals.
| Tool | Best For | Natural Language | Predictive Analytics | Setup Complexity | Price Range |
| ProactiveAI | All business teams | Yes | Yes | Low | Mid-range |
| Looker Studio | Google ecosystem users | No | No | Low–Medium | Free |
| Power BI | Enterprise BI teams | Partial | Partial | High | $10+/user/mo |
| Mixpanel | Product/growth teams | No | No | Low–Medium | Free tier available |
| Hotjar | UX/website teams | No | No | Low | Free tier available |
| Amplitude | Product analytics teams | No | Partial | Medium | Custom pricing |
What Are the Best Practices for Non-Technical Teams Adopting Analytics?
The first step is to obtain a no-code tool. It’s one thing to get the team to use it, and another to use it well. Some rules distinguish adoption from abandonment.
Start with one question, not one dashboard
The typical error is to attempt a complete reporting solution at the start. Rather, determine what the top one question is that your team has about the week, and create the answer first. Success compounds.
Connect your most-used data source first
Connecting whatever data your team already has, be it a CRM, ecommerce platform, or a spreadsheet, is the quickest way to value. Don’t rush things in before you get your first insight.
Create automation reports early
Most no-code platforms let you schedule when important metrics are delivered. Set this up during the first week. If numbers show up automatically in someone’s Inbox, usage increases because there’s no “going to the tool” friction.
Define your metrics once
Revenue means different things for sales, finance, and product. Before creating dashboards, make sure everyone on the team uses the same definitions. The best platforms, like ProactiveAI, let you define these numbers centrally so everyone works from the same numbers.
Don’t let anomaly alerts be a hindrance, but a feature
AI-driven no-code solutions can identify unexpected data changes. Don’t tag them as aside-the-point, but do encourage your team to discuss them. The key stories in your data are typically found in anomalies.
How Do You Choose the Right No-Code Analytics Tool?
When choosing a tool, ask yourself: who wants the data, what questions do they have, and which data sources do they want to access?
Ask who will actually use it
If you have marketers, salespeople, and operations leads who don’t know much about analytics, you need a truly conversational tool to help your team with complex tasks. Even with a drag-and-drop interface, you still need to understand data structure. A natural language interface is not a substitute.
Ask what questions need answering
Mixpanel and Amplitude are used for product behavior questions. For website experience questions, it’s time for Hotjar. Questions across the business (revenue, pipeline, inventory, customer trends, etc.) require a more enterprise-class BI solution such as ProactiveAI or Looker Studio.
Ask what data you’re starting from
The most useful tool integrates easily with where your data lives. If you have an ecommerce business using Shopify data, CRM data for customers, and data from marketing platforms such as Google Ads, you need a platform that integrates all three without engineering.
Ask what you’ll need in six months
Some tools are great at reporting where you are, but not at forecasting. If your team will eventually need revenue forecasting or a demand forecast without a data scientist on the team, build that capability into your evaluation.
Consider total cost of adoption
There’s only one number for the licensing cost. Include your team’s training time with the tool, IT setup time, and the expense of maintaining data connections. No-code tools may have higher licensing costs, but they can lower total cost because they deploy quickly and require little maintenance.
Why ProactiveAI Is Built for Non-Technical Teams
Most analytics platforms were built for analysts and then made easy for business users. ProactiveAI does it differently, building its platform specifically for teams that don’t need overly complex dashboards but do need answers.
The conversational interface lets users query in natural language, such as: What was our most successful product category last quarter? Why was churn up in June? No need to master complicated queries and analytics tools.
Additionally, ProactiveAI has an automated AI dashboard builder that generates relevant visualizations based on your data, so teams can gain insights without spending weeks configuring reports.
Its predictive analytics provide insights and keep forecasts up to date for sales and revenue teams. The platform’s blog is also packed with useful tips and tricks on ecommerce, sales, and marketing analytics.
ProactiveAI helps business teams act on data rather than wait for analysts, closing the technical divide between data and decision.
Conclusion
Teams without technical skills can access data easily with no-code analytics. Marketing, sales, operations, and executives are no longer dependent on analysts for reports and can now explore data, monitor KPIs, and derive insights themselves.
The ideal platforms offer natural language queries, automated reporting, anomaly detection, and predictive analytics in addition to dashboards. The final decision on the best solution will depend on the company’s objectives, data sources, and technology skills.
As businesses become more data-driven by the day, converting data into real-time action will be a competitive edge. As a result, non-technical teams can make quicker, smarter, and more confident decisions, with platforms such as ProactiveAI making this possible with less complexity.
Frequently Asked Questions
What are no-code analytics tools, and who are they designed for?
No-code analytics tools allow business users to analyze data, create reports, and track KPIs without coding or writing SQL. They are built for non-technical users like marketers, sales and operations leads, founders, and anyone who wants data insights but lacks an analytics background or the time to learn complex software.
Can no-code analytics tools replace a dedicated data analyst?
Not entirely. For repetitive reporting, dashboard building, and common business queries, no-code solutions are effective. A good analyst remains useful in nuanced statistical reasoning, data architecture, and complex modeling. The value of no-code tools is that analysts are no longer bogged down in repetitive requests and can focus on higher-value tasks.
How long does it take to set up a no-code analytics tool?
Setup time will depend on the platform and the complexity of the data. ProactiveAI or Looker Studio can provide initial insights within hours of connecting a data source. Enterprise tools such as Power BI may require weeks or days of configuration before non-technical users can access clean, reliable reports.
Are no-code analytics platforms secure enough for business data?
Enterprise-grade no-code analytics platforms include role-based access controls, compliance certifications (SOC 2, GDPR), and encryption. Before you adopt any tool, make sure it can process data according to your industry’s needs, especially if you’re dealing with customer PII or financial data.
How does conversational AI make analytics easier for non-technical users?
Conversational AI enables users to input natural language questions like ‘What caused the revenue decline last week? and get a structured response as a chart and explanation. This eliminates the need to know which measurements to access, how to tidy data for a measurement, or how to create a visualization. It’s the best thing that technology has to offer without having a data analyst on call.
Can no-code analytics tools handle predictive analytics?
Yes, increasingly. Platforms such as ProactiveAI also have AI forecasting capabilities that automatically generate models for future sales, identify demand fluctuations, and monitor revenue trends, without requiring users to create or set up statistical models. The underlying machine learning runs automatically as new data comes in.
You might also like
Handpicked articles for your reading list.

Get the latest insights on Conversational AI
Stay ahead of the curve with weekly updates on data analytics, AI trends, and eCommerce growth strategies delivered straight to your inbox.
Join 5,000+ industry leaders. Zero spam, just pure insights.