
 SparxIT
 SPXCommerce
 What's Your A



eCommerce
AI & Analytics
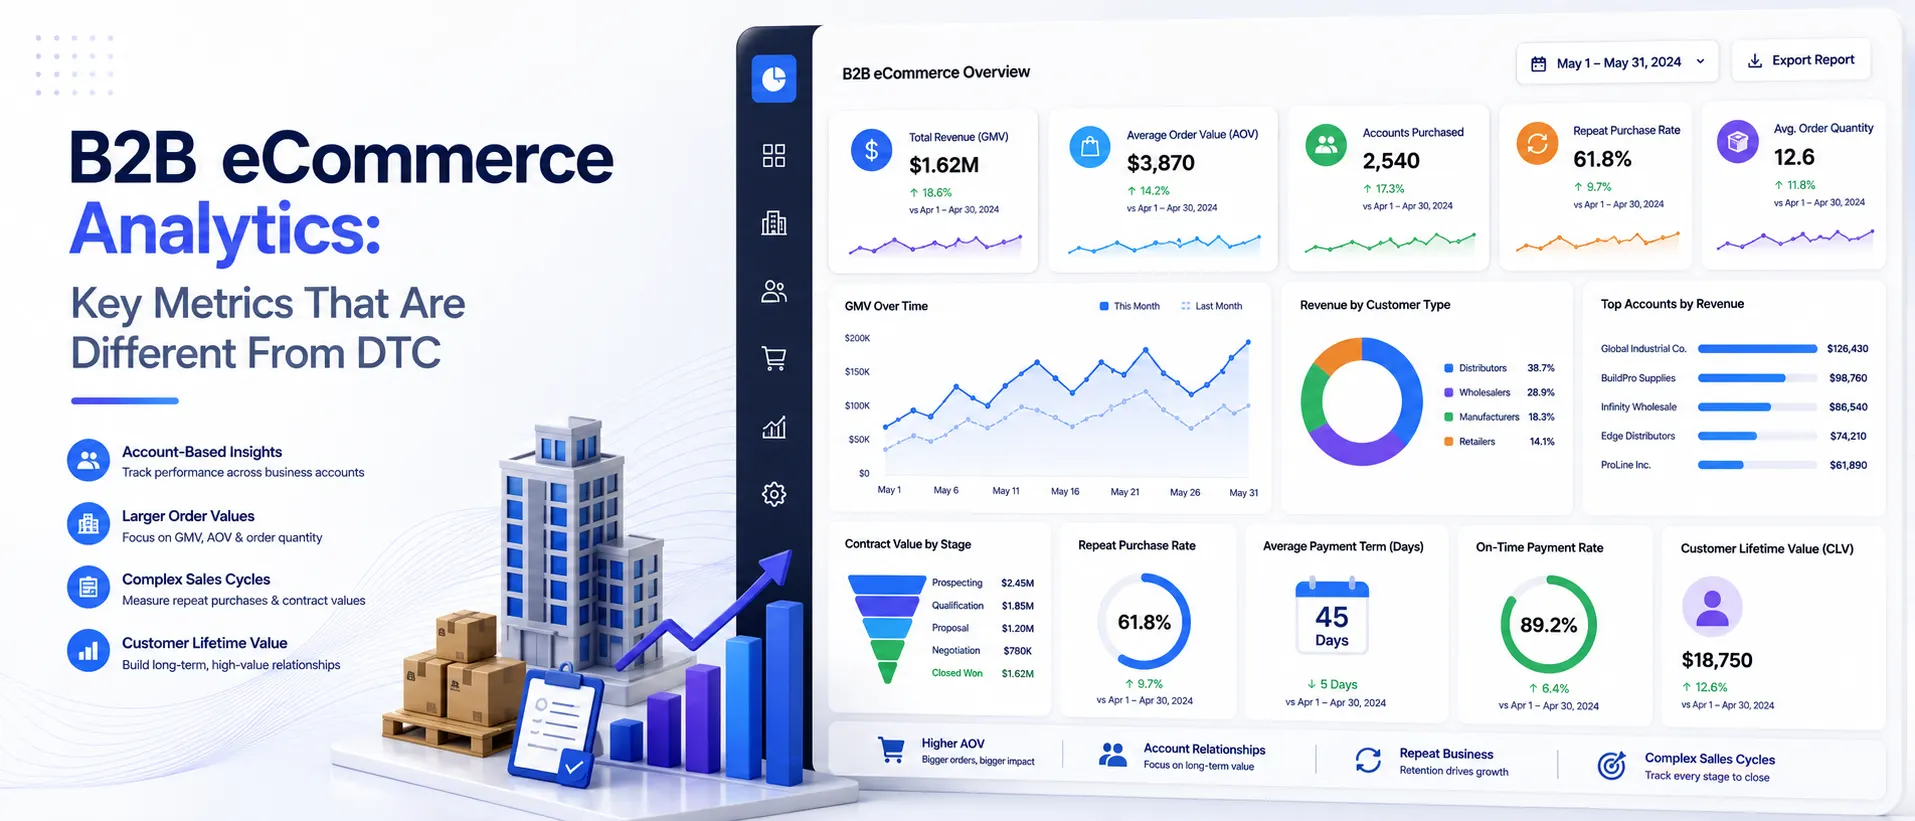
B2B eCommerce Analytics: Key Metrics That Are Different From DTC
-
Vikash Sharma
- Aug 11, 2026
- 8 mins read
If you have ever used your DTC ecommerce metrics playbook with a B2B business, then you know the frustration. The dashboards may look similar, and the terminology may overlap, but applying the wrong analytical framework can produce misleading insights and delay growth.
The fundamental issue is structural. DTC commerce typically centers analytics around individual customers, transactions, and shorter purchase cycles. B2B ecommerce is built on complex account relationships involving dozens of contacts, hundreds of reorders, and years-long contracts. If your analytics model doesn’t reflect that, you’re optimizing for the wrong thing.
The good news is that as long as you understand the reasons for the differences, you can create the appropriate B2B ecommerce analytics framework with much more clarity. This also helps metrics be more sensible and understandable.
What is B2B eCommerce Analytics?
B2B ecommerce analytics refers to the process of gathering, analyzing, and reporting data from your digital sales channels, buyer portals, self-service ordering systems, and quote workflows. Along with data from procurement systems, it also helps you make more informed business decisions.
B2B buyers now engage with an average of 10 channels during their purchase journey, with about one-third of those interactions occurring through digital self-serve, per McKinsey. This has simplified data collection, but complicated the interpretation process, particularly when teams fall back on DTC thinking.
Unlike consumer commerce, B2B analytics has to account for:
- Multi-stakeholder buying: These could include procurement, finance, operations, and C-suite approval.
- Contract-based revenue: Not many B2B relationships reset after every sale, and instead, they add up.
- Account-level behavior: Individual user clicks are less important than what the account does over time.
- Operational complexity: Fulfillment accuracy, invoicing, and delivery timeliness are more effective at driving retention in this dimension than in DTC.
B2B data can produce misleading insights when analyzed through a consumer-centric ecommerce reporting dashboard.
Why Do DTC Metrics Fall Short in B2B?
DTC ecommerce metrics are geared towards volume and velocity. For a DTC brand, checkout conversion rate, Return on Ad Spend (ROAS), repeat purchase rate, and customer acquisition cost (CAC) are all metrics they care about, and each is based on a short buyer-traffic stream.
The B2B buying journey follows a more complex funnel involving multiple stakeholders, longer sales cycles, quotes, approvals, and negotiated purchases.
Consider CAC. For DTC, CAC is a straightforward calculation like ad spend divided by the number of new customers acquired. In B2B, one account could take 6-12 months to acquire, with multiple demos, a pilot order, and a negotiated agreement. This is because your CAC in B2B is typically 5-10x greater than your DTC CAC, but so is the value you’ll generate in the years to come. Without this context, comparing B2B and DTC CAC can lead to poor budget allocation decisions.
Likewise, in B2B, the e-commerce checkout conversion rate is essential but not a success metric. A B2B buyer could log in to your portal 12 times before making their initial purchase order, and that one order begins a 3-year relationship. B2B optimization should also consider quote progression, approval cycles, reorder frequency, account penetration, and long-term account value.
DTC brands also rely heavily on ROAS for paid acquisition. B2B acquisition typically involves multiple channels and longer attribution paths, making single-touch ROAS analysis less representative. However, paid channels should be used alongside other channels, and it is often incorrect to attribute revenue to just one campaign.
What Are the Core B2B Account-Level Metrics You Actually Need?
This is where B2B ecommerce analytics becomes truly special. The metrics below are either uniquely B2B or are different enough from their DTC counterparts to be considered distinct constructs:
1. Account Lifetime Value (ALTV) vs. Customer Lifetime Value
CLV estimates the economic value generated by an individual customer over the duration of the relationship. In B2B, you are tracking ecommerce metrics at the account level, like the revenue and margin you’re generating against a buying organization over time.
ALTV will, in almost all cases, exceed DTC CLV, but will be more fragile. If you lose the key contact at an account, you might lose the account altogether. That means the human dependency makes ALTV more difficult to predict and a critical factor to watch more closely.
2. B2B Average Order Value (AOV)
B2B AOV is not only larger but also uniquely structured. DTC AOV is affected by seasonal promotions and impulse purchases. B2B AOV is likely to vary according to contract specifications, approved supplier lists, and negotiated pricing tiers.
Higher B2B AOV can indicate greater account penetration when buyers expand their purchases across additional SKUs or product categories. If total order frequency doesn’t change but AOV is also declining, it could be that buyers are spreading their purchase activity among competitors.
3. Cart-to-Quote Conversion Rate
DTC has the problem of cart abandonment. B2B uses cart-to-quote conversion as a measure of how many buyers who start an order go on to request a quote or progress to a formal purchase order.
This is one of the most obvious indicators of problems with your B2B digital portal. Purchasers who are looking to put up carts and are coming back on the sidelines typically have issues with their approval process, price visibility, or the presentation of payment terms.
4. On-Time In-Full (OTIF) Rate
OTIF is a percentage of orders that are delivered on time and in full. The OTIF levels for mature B2B organizations are 95–98%. Violate it, and you’re in for chargebacks, contract penalties, and churn, all of which DTC brands don’t experience on the same level.
Key performance indicators (KPIs) for order fulfillment, such as OTIF, lie at the heart of operations and sales. Poor OTIF performance can become a leading indicator of account dissatisfaction, contract risk, and non-renewal.
5. Days Sales Outstanding (DSO) in eCommerce
DSO measures the average number of days a business takes to collect outstanding accounts receivable. DTC businesses typically collect payment at checkout, while B2B transactions often involve negotiated payment terms and accounts receivable. Net-30 or Net-60 is the typical payment timeframe in B2B, so DSO is a real-time reflection of your cash conversion health.
Best-in-class B2B teams take less than 3 days to process an invoice with less than 10% exceptions. The buyers’ working capital is on the line when teams have an average of 22% invoice exceptions and a 17-day processing time, which directly impacts growth capacity.
6. Account Churn Rate vs. Customer Churn
DTC businesses also monitor churn and retention, but the financial impact typically occurs at the individual customer level rather than across entire business accounts.
In B2B, churn is much more common. For mid-market accounts, it could be $200K–$2M in annual recurring revenue. One of the most important metrics is account churn rate, which refers to the percentage of active accounts that cease buying over a given timeframe, and is one of the metrics that is least tracked by teams still based on DTC frameworks.
7. Net Revenue Retention (NRR) in eCommerce
NRR includes revenue growth of your current account base, including expansions, upsells, and churn. An NRR above 100% indicates that expansion within the existing account base has offset churn and contraction, supporting growth without relying solely on new customer acquisition.
NRR is particularly valuable in B2B because it captures expansion, contraction, and churn within an existing account base. It is the best indicator of the success of your B2B customer growth and expansion efforts.
How Do B2B and DTC Metrics Compare Side by Side?
While B2B and DTC ecommerce share some KPIs, how they are calculated and analyzed differ significantly. The key differences are highlighted, and the reasons underlying the need for an account-centric analytics approach are explained below.
| Metric | DTC Version | B2B Version | Key Difference |
| Customer Lifetime Value | Individual CLV | Account Lifetime Value (ALTV) | Account = entire org, not one person |
| CAC | Campaign spend ÷ new customers | Total acquisition cost (multi-channel, long cycle) | B2B CAC is 5–10x higher; payback period longer |
| Conversion Rate | Checkout conversion rate | Cart-to-quote conversion rate | B2B converts to quotes, not instant purchases |
| Fulfillment KPI | Delivery speed | OTIF rate | B2B has contractual obligations and chargebacks |
| Revenue Retention | Repeat purchase rate | Net Revenue Retention (NRR) | NRR captures expansion within existing accounts |
| Payment Health | N/A (instant payment) | Days Sales Outstanding (DSO) | B2B payment terms create cash flow complexity |
| Churn | Customer churn rate | Account churn rate | One account = outsized revenue impact |
What Does a Strong B2B Analytics Strategy Look Like?
The first step is to get the right metrics. Constructing a B2B ecommerce tracking system that delivers actionable insights is more difficult and requires some must-have components.
1. Track at the account level, not just the user level
Many web analytics platforms are based on single sessions. The challenge with B2B is that you need to connect the dots for each user, role, and touchpoint within the account. If you don’t have stitching at the account level, your data only tells you what people have clicked, and not what accounts are doing.
2. Build a B2B digital portal adoption rate metric
For self-service portals, it is important to understand the percentage of eligible accounts that are using the portal. One of the most prevalent silent killers of B2B ecommerce ROI is low portal adoption, and it often isn’t even reflected in typical traffic reports.
3. Use B2B self-service analytics to spot friction before it becomes churn
Those are early signs to look out for: when accounts can no longer sign in, when order frequency decreases, or when support tickets are raised to submit invoices. Self-service analytics can surface these patterns early enough for teams to address friction before it contributes to account loss.
4. Connect fulfillment data to account health
OTIF and DSO are not only operational metrics but also account health metrics. Any decrease in fulfillment accuracy for an account is usually followed by a call to renegotiate or exit.
5. Add AI sales forecasting to your planning stack
B2B demand is characterized by seasons, contract cycles, and account-specific rhythms, and is difficult to extrapolate in spreadsheets. With far greater precision, AI sales forecasting tools can predict these patterns, minimizing stockouts and overstock situations that subtly erode account trust over time.
How Can ProactiveAI Help You Track the Right B2B Metrics?
ProactiveAI is an AI-powered ecommerce analytics platform designed for B2B businesses that transforms raw operational data into actionable information on an account-by-account basis. It enables teams to make better, faster decisions without investing in complex reporting or data engineering.
Its ecommerce analytics dashboard aggregates both critical metrics such as Account Lifetime Value (ALTV), Net Revenue Retention (NRR), account churn risk, OTIF performance, and DSO trends into a single place that provides a clear picture of the overall health of the accounts.
With conversational analytics, sales, account managers, and operations teams can ask questions in plain language and get instant, actionable answers no SQL or manual reports required.
In addition, it has AI-powered forecasting capabilities that enable prediction of demand and growth opportunities, track B2B portal adoption, identify churn risks, and support customer success teams in better retaining customers in nuanced, multi-account setups.
Conclusion
B2B ecommerce analytics is about a more unique approach compared to traditional DTC reporting. Although DTC metrics are important for single transactions and short buying cycles, B2B success hinges on long-term account relationships, operational performance, and revenue retention.
Other metrics such as Account Lifetime Value (ALTV), Net Revenue Retention (NRR), OTIF, Days Sales Outstanding (DSO), and account churn provide a much better assessment of the business’s health. These KPIs can guide companies to make informed decisions that drive growth and customer retention.
An effective B2B analytics strategy is more than just about reporting. Integrating account-level data, tracking portal usage, leveraging operational analytics, and employing AI-driven forecasting creates a powerful toolset for businesses to detect potential threats at an early stage, enhance the customer journey, and discover fresh avenues for expansion.
Those who use the right metrics, not just the standard DTC metrics, will enable them to fine-tune performance, improve customer relationships, and drive long-term sustainable growth in their B2B ecommerce endeavors.
Frequently Asked Questions
How do B2B ecommerce metrics differ from DTC?
The metrics used in B2B are geared more towards account health, longer-term relationships, and operational performance, whereas DTC metrics are more directed towards the individual purchase, marketing efficiency, and short-term customer transactions.
What metrics should B2B ecommerce track?
Some key metrics that help B2B companies track growth and retention include ALTV, NRR, OTIF, DSO, account churn, Average Order Value (AOV), portal adoption, and Cart-to-Quote Conversion Rate.
What are the important KPIs for B2B ecommerce portals?
The most important portal KPIs for enhancing the customer experience are portal usage, frequency of active accounts, Cart-to-Quote Conversion Rate, repeat order frequency, self-service engagement, and account activity.
What is the difference between B2B and DTC ecommerce analytics?
B2B analytics focuses on accounts, contracts, and retention, while DTC analytics is about individual customer actions, conversions, and marketing performance.
What are the key performance indicators for B2B digital transformation?
Monitor tools and indicators of digital adoption, operational efficiency, and long-term business growth, including tracking portal adoption, ALTV, NRR, OTIF, self-service usage, and forecast accuracy.
You might also like
Handpicked articles for your reading list.

Get the latest insights on Conversational AI
Stay ahead of the curve with weekly updates on data analytics, AI trends, and eCommerce growth strategies delivered straight to your inbox.
Join 5,000+ industry leaders. Zero spam, just pure insights.