
 SparxIT
 SPXCommerce
 What's Your A




eCommerce
eCommerce
eCommerce Return Rate: How to Track, Benchmark, and Reduce Product Returns
-
Vikash Sharma
- Jul 09, 2026
- 10 mins read
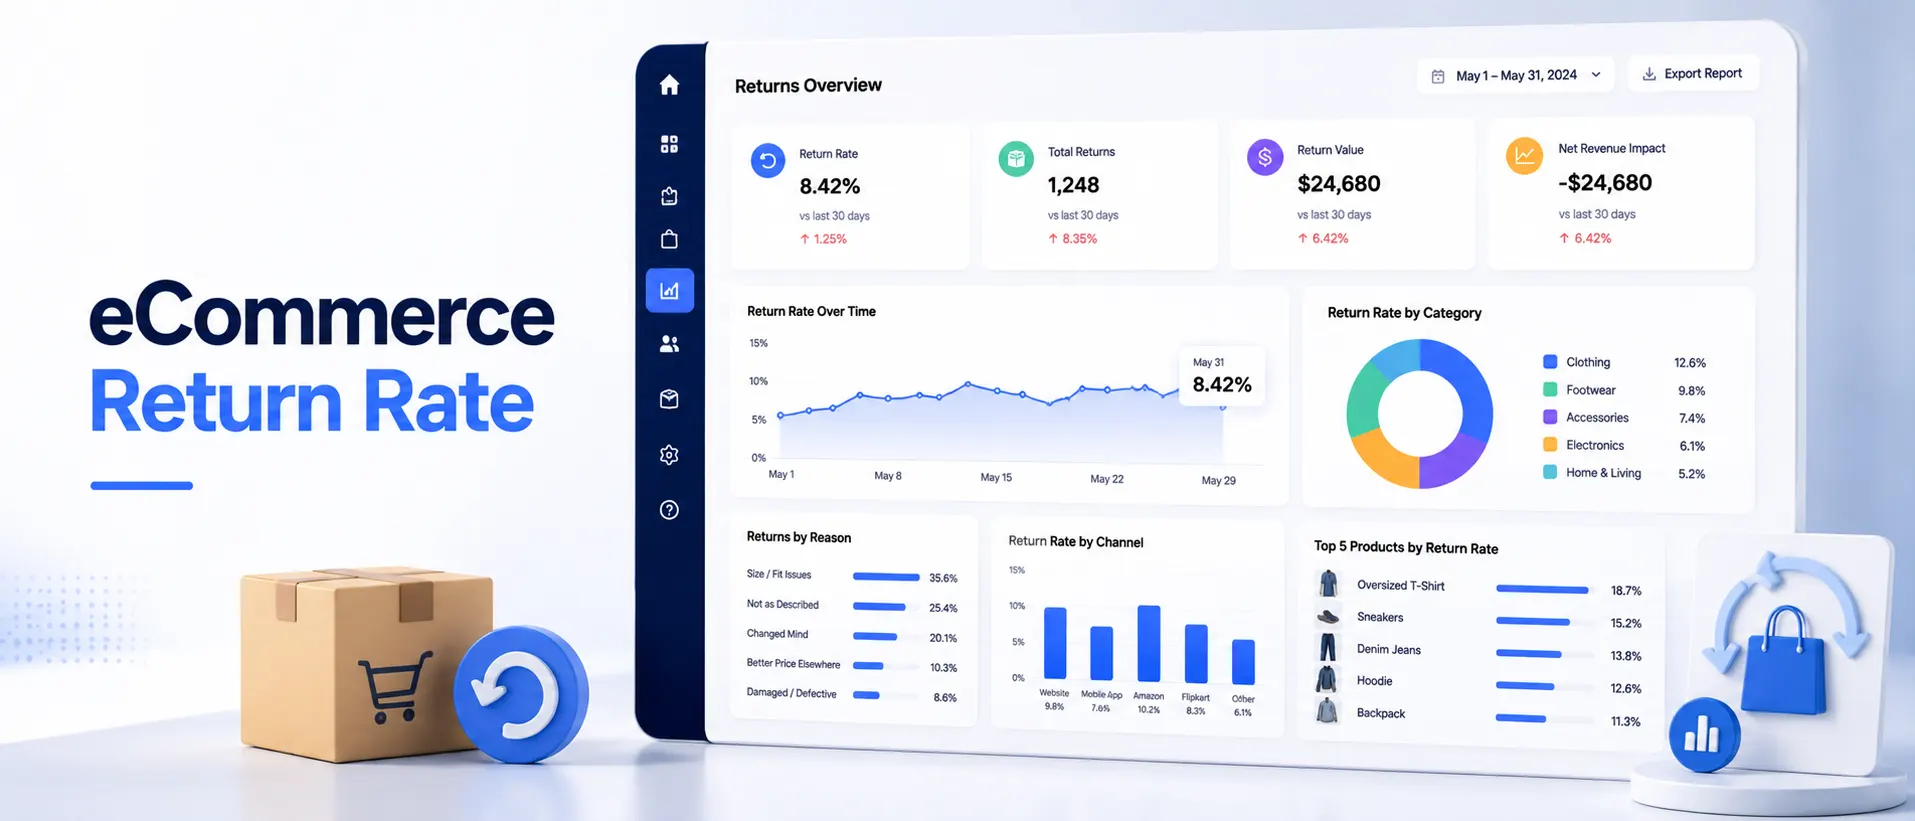
Every eCommerce operator has experienced this situation. It’s a record sales day, orders are pouring in, and revenue looks strong until product returns begin. Now the day of the win seems a little less spotless. Returns are a cost of revenue, put pressure on your operations team, increase logistics costs, and slowly take chunks out of your gross margin. The eCommerce return rate is one of the most costly metrics that many online retailers must contend with.
Product returns have become a permanent operational challenge for eCommerce businesses. People are shopping online more than ever before and, as a result, have higher expectations, and when it comes to products, they no longer tolerate being disappointed.
However, these are the brands that are succeeding in this market. They accurately monitor return reasons, compare them against industry averages, and identify patterns through eCommerce analytics. Based on these insights, they make targeted changes that reduce unnecessary return costs without negatively impacting the customer experience.
This guide teaches you how to do that, from measuring your eCommerce product return rate and comparing it to industry standards to understanding what’s actually causing returns by leveraging analytics tools.
What Is eCommerce Return Rate and How Is It Calculated?
The eCommerce return rate is defined as the percentage of products returned by customers from sales over a specific period of time. It is one of the most obvious indicators of buyers’ comprehension of your product listings, fulfillment process, and customer experience.
The formula is simple:
Return Rate = (Number of Returned Items ÷ Total Items Sold) × 100
If customers returned 1,800 items out of 10,000 sold last quarter, your return rate would be 18%.
Other retailers may do it by order rather than by units, which yields a slightly different number but is similar for business insights. Consistency is essential regardless of the calculation method you use, and apply it consistently to make your trends comparable over time.
What the eCommerce refund rate adds to the picture
The return rate indicates the percentage of products returned. The eCommerce refund rate measures the percentage of orders that result in refunds. Your refund rate may be noticeably lower than your return rate if you have a robust exchange program or store credit policy, which is a nice profit margin to guard and a crucial difference.
There is clearly synergy in tracking both metrics, as it helps you gain a more comprehensive understanding of the real value of your returns on cash flow and customer lifetime value.
What is the eCommerce Return Rate Benchmark by Industry?
You can’t get better than you are if you don’t know how you compare with your category. What might be a problem in one vertical could be completely normal in another.
According to 2026 industry data, average return rates vary by category:
| Category | Typical Return Rate | Primary Driver |
| Apparel & Footwear | 25–40% | Fit and sizing uncertainty |
| Electronics | 8–11% | Compatibility and performance expectations |
| Home Goods & Furniture | 15–20% | Color, scale, and style mismatches |
| Beauty & Personal Care | 10–12% | Lack of confidence in shade, fragrance, or formulation suitability |
| Sporting Goods | 10–15% | Product size and suitability for intended use |
| Overall eCommerce Average (2026) | 19–20.5% | The gap between customer expectations and actual product characteristics |
| Brick-and-Mortar Retail (All Categories) | ~9% | Impulse purchases, gift-related returns, and unmet expectations |
One vertical that stands out in eCommerce is apparel, whose return rate is always the highest. And the reason there’s no need to wonder is quite apparent. Without being able to feel the fabric and try on the garment, shoppers are making their size decisions based on a size chart and a few photos. There is also a technique called “bracketing” that makes return rates even higher in fashion: shoppers knowingly order two or three sizes, only to return two or three that don’t fit.
The eCommerce (19-20.5%) brick-and-mortar (9%) discrepancy shows that a large part of online returns is not caused by product quality issues but by inherent limitations of shopping online. This is where many returns can be avoided with more information, thoughtful product displays, and post-purchase messaging.
How Product Returns Impact Gross Margin
At this stage, product returns become a financial issue that directly affects executive decision-making. Each returned item is not only a loss of the sale but also a loss of reverse logistics, restocking labor, and, in many cases, the product itself if it can’t be sold at full retail.
Let’s look at an abbreviated version of the actual price of one return.
- Outbound shipping: Used up, unrecoverable
- Return shipping: Mostly charged by the retailer, the average is $8-$15 per return.
- Processing and restocking: Labor cost, inspection, and re-packaging
- Inventory write-downs: Goods which are not readily saleable as new (damaged, used, or out-of-date, etc.)
- Opportunity cost: Capital remains tied up in returned inventory instead of generating revenue.
If a product has an average order value of $50 and a 40% gross margin before returns, then the return of one product can wipe out the margins of two to three other products. So, when you extrapolate that to hundreds or thousands of returns per month, the returns have a huge effect on gross margin, one of the largest profit levers in your entire business.
What’s important is your net revenue after returns, which is your gross revenue minus the financial consequences of returns and refunds. Some brands boast about their top-line, but a more sobering story is the net revenue after returns.
The profitability math on the return on investment for return programs
A two- or three-percentage-point improvement in return rate will make a significant contribution to margin improvement. With an annual revenue of $2M, a 25% return rate, and a 22% drop in return rate, you’re losing approximately $60,000 in return business revenue, not to mention the operational cost savings! It’s a great ROI for the returns-reduction program, which is why the most cost-conscious eCommerce brands do not view this as a customer service problem.
How to Track and Analyze the eCommerce Return Rate?
Most eCommerce analytics dashboards will tell you that returns are taking place. Few of you explain the “why,” and that’s where the leverage is.
One of the key components of effective eCommerce returns analytics is collecting data at several different levels:
Return reasons (the most underused data source)
If the customer is returning a product, the reason should be a field, not a free-text field, and it should be a field that corresponds to a structured taxonomy. Categories might include:
- The product does not match its description due to inaccurate images, copy, or specifications
- The product does not fit or is the wrong size (sizing chart problems, product sizes, bracketing behavior)
- Poor quality (material, construction, durability)
- The item has been damaged for some reason (packaging/carrier mistake)
- Mistake in thinking / unintended use order (impulse buying/buyer’s remorse)
- Received a different item (warehouse or fulfillment error)
If you have structured data on return reasons, you can analyze it by SKU, category, supplier, and even customer segment. If a product has a 38% return rate due to “size runs small,” you definitely need to update your size guide. Several “damaged on arrival” returns in a specific area may indicate a carrier or packaging issue.
What to set up for the Shopify Return rate tracking?
Your return rate doesn’t appear automatically as a native metric for Shopify merchants, so businesses must create custom reporting. These are the most typical ways to do it:
- Order Status & Refunds custom reports are fetched from the Shopify Reports section.
- Third-party return management platforms with structured return data (Loop or AfterShip) that return the information to your analytics stack
- Get your Shopify data linked to an eCommerce analytics system that integrates returns data with other KPIs
It’s a single view that will include return rates by product, collection, and acquisition channel, and a trend over time, all without having to look at a bunch of spreadsheets.
Using an eCommerce analytics platform to surface return patterns
Return analytics platforms such as ProactiveAI make self-service analysis possible with your returns data, allowing your team to ask questions about return patterns in natural language rather than sending every report to a data analyst.
A merchandising manager can simply ask, “Which products do you see returning the most this month, and what are the top reasons for returns for each of these products?” and get the answer in seconds.
Such eCommerce AI analytics in conversation help teams work faster and resolve the problems that lead to returns.
What are the strategies to reduce the return rate in eCommerce?
Reducing product returns requires a multi-layered strategy spanning merchandising, fulfillment, customer experience, and post-purchase engagement. The following strategies always have an impact.
1. Close the expectation gap with richer product content
The biggest single culprit when it comes to unnecessary returns is a mismatch between the customer’s expectations, as they see your product in your listing, and your product as it is delivered. The solution? Close that gap before they purchase.
- Photography: Display the product in use, at scale, in a variety of ways. Use lifestyle photographs to convey “real-world context.
- Video: Product videos can significantly reduce returns in categories such as furniture, apparel, and electronics, where movement and scale are important.
- Specifications that are accurate and complete: Size dimensions, material compositions, weight, compatibility, and precise and complete.
- Honest copy: Don’t exaggerate. You protect yourself twice with a product description that has realistic expectations: First, when you attract the wrong kind of customers to your site, you filter them out, and second, when you attract the right kind of customers to your site, you create a mental model for them.
2. Solve the sizing problem in apparel
Apparel return rates will remain high unless retailers address sizing accuracy. Effective solutions include:
- Brand-specific size guides (not generic S/M/L charts) with actual measurements.
- Fit recommendation tools powered by customer input (height, weight, fit preferences).
- Show positive user feedback on the product page that prominently mentions “runs small” or “true to size”.
- Model diversity shows the product on multiple body types with their stated measurements.
3. Improve post-purchase communication
Many returns occur due to customers’ lack of confidence or assistance following order placements. A proactive after-sales process that includes order confirmation with the exact delivery period and shipping notifications minimizes buyer’s remorse. Providing care plans and setup instructions also reduces uncertainty about the order, helping prevent return requests.
4. Redesign your return policy to direct towards exchanges
Your return policy should encourage customer behaviors that protect revenue while maintaining satisfaction. If your default flow pushes customers towards a refund, you lose revenue and the relationship. Making it the default and easiest way to get paid (as exchange or store credit) means you keep the money while still pleasing the customer.
Tactics that work:
- Offer store credit as the standard form of payment, and a refund is available upon request.
- Provide an incentive to exchange instead of a refund (“Get $5 extra towards exchange”)
- Provide suggestions for different products to return, based on the originally purchased item and the reason for the return.
5. Fix quality and fulfillment issues systematically
You’re getting returns indicating there’s something wrong with your supply chain. Analyze return-reason data for common quality issues to correct them at their source, with the supplier, or in the production batch. Likewise, monitoring fulfillment errors, such as an incorrect item being sent or the item not being in the order, and working with your 3PL or warehouse partner to minimize picking and packing errors.
6. Use predictive analytics to anticipate high-return products
A great way to take a proactive approach to reducing returns is to anticipate which items are likely to be returned. AI sales forecasting tools can learn how product characteristics and customer reviews relate to past return activity. They can identify new SKUs or seasonal launches that are likely to follow the same high-return trends. This gives you time to respond with a better product offering or reduce inventory positions before returns start to roll in.
Using ProactiveAI to Power Your Returns Intelligence
To understand your return information at the level needed to make decisions, you need more than a simple dashboard. It needs to be capable of slicing return data by SKU, category, customer segment, and acquisition channel, and of answering ad hoc questions without waiting for the data team to create a report.
ProactiveAI is an eCommerce analytics platform designed for operational intelligence. It’s an eCommerce KPI dashboard that consolidates your key financial and operational metrics, such as return rate, refund rate, and net revenue after returns, all in one place. It then uses AI to automatically analyze these metrics, uncovering trends and anomalies.
ProactiveAI is the backbone for eCommerce teams on Shopify or any other platform, enabling the transition from reactive returns management to proactive intelligence without requiring a data engineering team.
Conclusion
There are few metrics as impactful as the eCommerce return rate for your business, and few are used less. This is a missed opportunity for brands that view their returns as a customer service expense to be reduced. This way, your return data tells you where your product content, sizing tools, fulfillment process, and post-purchase experience are failing.
Reducing return rates requires a structured, data-driven approach. Get accurate return rate and eCommerce refund rate calculations. Compare them to your category. Store structured return reason information and examine it by SKU. Target the best-performing products for improvement.
Create a return policy that encourages exchanges or store credit instead of refunds whenever appropriate. And leverage analytics tools which provide your team with real-time visibility into the effect returns are having on your gross margin and net revenue.
When you’re looking to go beyond reporting and take real returns intelligence capability, ProactiveAI can help you do just that, with AI-powered analytics for eCommerce operators who want to make quick, confident decisions.
Frequently Asked Questions
What is the return rate in eCommerce, and how is it calculated?
eCommerce return rate is the percentage of products returned by customers after purchase. Determine it by dividing the number of returned items by the number of items sold, then multiplying by 100. The example of 10,000 sales and 1,800 returns indicates a return rate of 18%.
What is the average return rate for eCommerce by industry?
The average eCommerce score for all of 2026 is 19–20.5%. Sizing issues are a problem for apparel and footwear, which have the highest percentage at 25-40%. Electronics average 8–11%, beauty 10–12%, and home goods 15–20%. All categories average about 9% brick-and-mortar.
How do product returns impact gross margin and profitability?
With returns, there is no margin for several sales at once, lost revenue, outbound shipping cost already incurred, return shipping cost, and restocking labor. Starting with a high return rate can turn a great month into a bad one if net revenue after returns is calculated.
What are the most effective ways to reduce eCommerce return rates?
First, bridge the gap of expectation through the right kind of photos, accurate specifications, and straight-shooting copy. Adopt brand-specific fit guides and fit tools for apparel. Redesign the return flow to make exchanges more rewarding than refunds. Resolve or correct quality and fulfillment issues using structured return-reason data.
How do you track and analyze return reasons to improve products?
Use a structured taxonomy for capturing return reasons, rather than a free-text field, at the return initiation. Review the reasons for returns on SKU, category, and supplier levels with eCommerce analytics tools. If the returns are high in a specific area (e.g., “runs small”), it goes straight to areas that need to be addressed (e.g., better size guides, copy correction).
You might also like
Handpicked articles for your reading list.


Get the latest insights on Conversational AI
Stay ahead of the curve with weekly updates on data analytics, AI trends, and eCommerce growth strategies delivered straight to your inbox.
Join 5,000+ industry leaders. Zero spam, just pure insights.