
 SparxIT
 SPXCommerce
 What's Your A



eCommerce
AI & Analytics
The Complete Amazon Seller Analytics Guide and Tools
-
Vikash Sharma
- Sep 02, 2026
- 8 mins read
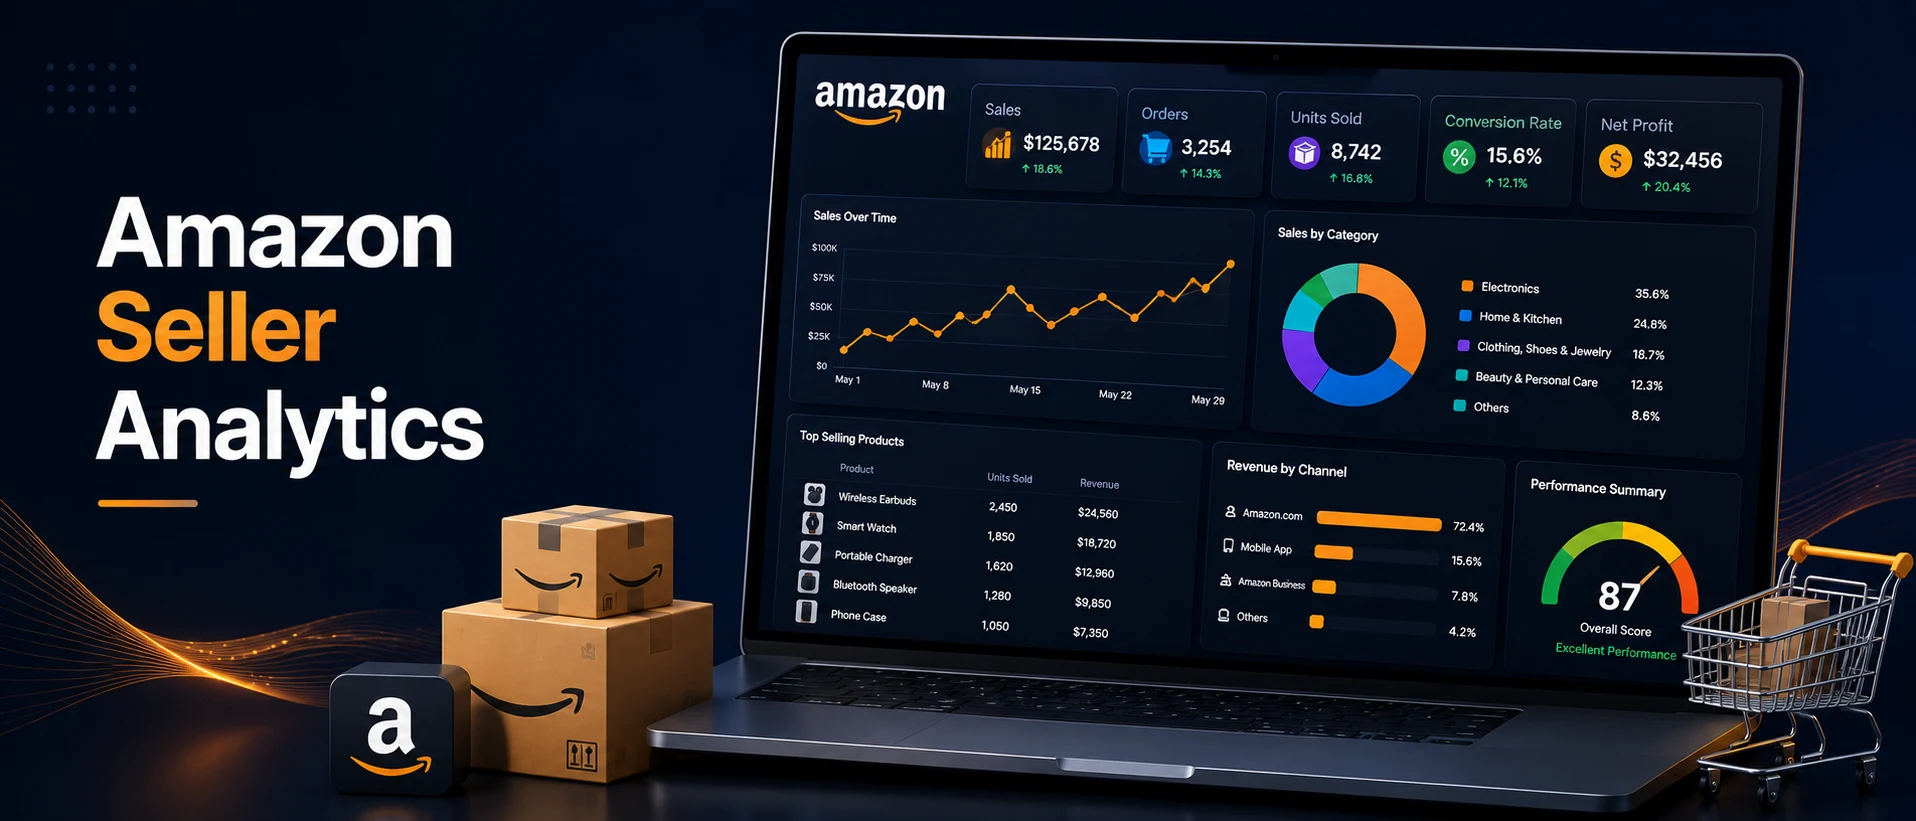
You have a store that sells on Amazon, your sales are picking up, and your numbers look fine at first glance. But you continue making less and less profit, your advertising costs continue to rise faster than sales, and you really don’t know what products are earning you a profit or those that are silently draining profits.
This challenge rarely comes from a lack of data. It comes from fragmented data that fails to reveal what drives profitability. Seller Central provides extensive reports, but they don’t always translate raw data into actionable business insights.
How sellers use Amazon Seller Analytics can determine how effectively they identify opportunities, control costs, and scale profitably. Analytics goes beyond pulling numbers by connecting data points to provide a clear view of business performance. Sales, fees, advertising, returns, and inventory the big picture of what works, what doesn’t, and what needs to be done.
Whether you’re looking for an Amazon seller analytics tool to track the right metrics or explore which metrics are most important, this is the guide for you.
What is Amazon Seller Analytics?
Amazon Seller Analytics is about gathering, analyzing, and using data from your Amazon business, such as sales, profitability, advertising, product performance, and business health, to make smarter decisions quicker.
It’s more than what Seller Central displays. With Native Amazon reports, you will have raw exports: tables of data to scroll through and decipher. The ‘why’ layer comes from analytics tools. What caused the decline in profit by 11% on Tuesday last week? Why does TACoS creep up despite ACoS showing good? Why is one SKU not working in Germany but working in the UK?
Data-driven organizations are 23 times more likely to acquire customers and 6 times more likely to retain customers. For Amazon sellers, that means better product decisions, more efficient ad spend, and fewer costly surprises.
Most accounts of Amazon seller analytics focus on five main areas: sales performance, profitability, advertising efficiency, product-level metrics, and operational metrics. They each respond to different questions. Together, they give you a holistic picture of your company in one place.
Why Does Amazon Seller Analytics Matter?
By leveraging Amazon seller analytics, businesses can move beyond revenue reporting to understand the root causes of profit, growth, and operational performance. Sellers can now analyze sales, advertising, fees, inventory, and returns to detect issues earlier and make better decisions.
Is Seller Central Enough to Run Your Business?
The answer is simply no! Seller Central reporting can involve delays that vary by report and metric, limiting its usefulness for timely decision-making. It doesn’t provide true profit (it doesn’t account for your COGS, expenses per product, PPC costs, or return impact). It will not alert you if it goes wrong, and that’s up to you.
Sellers with monthly revenues of $50K or more will find Seller Central’s built-in reporting too limiting for their needs. These reporting gaps can become costly as the business scales. For example, a PPC campaign that exceeds its budget may go unnoticed for days. If a SKU becomes unprofitable because of storage costs, sellers should identify the issue early rather than continue carrying inventory that erodes overall margins.
This is where proper analytics tools come into play as they automate the data pipeline, calculate profitability at every cost layer, and flag issues before they become too late.
What Are the Key Amazon Seller Metrics to Track?
Not all metrics are created equal. Here are the ones that experienced sellers keep an eye on on a regular basis:
Profitability Metrics
- CM1 after COGS, CM2 after marketing expenses, and CM3 after all expenses represent the CM by SKU.
- Net profit percentage per unit
- Return cost impact on margin
Sales & Demand Metrics
- Day revenue and SKU/Marketplace units
- Week-over-week velocity trend and month-over-month velocity trend.
- Buy Box win rate
Advertising Metrics
- TACoS (Total Advertising Cost of Sale): ad spend / total sales revenue, including organic revenue
- ACoS per campaign
- Organic-to-paid sales ratio
Operational Metrics
- Inventory Days of Supply by SKU
- Account health indicators
- Session-to-conversion rate
- The amount of product returned, expressed in percentage.
A common mistake sellers make is tracking revenue without understanding SKU-level profitability. When you factor in FBA fees, returns, storage, and ad spend, a product that generates $30K a month could have a $400 profit margin or be a $200 loss. Margin tracking for SKUs makes the difference between those who sell and those who spin their wheels.
What Are the Main Types of Amazon Analytics?
Typically, Amazon Analytics includes details of sales, profitability, advertising, product performance, and operational analytics. These areas provide a holistic view, helping sellers understand revenue drivers, margin erosion, and where to prioritize future efforts.
How Should You Structure Your Analytics Approach?
1. Sales Analytics
Monitors trends in revenue, units, and orders over time. Its aim is to pinpoint fluctuations in demand and their effect on price before they’re further compounded. Sellers who check daily can see a 15% drop in revenue that day. The problem is found 3 weeks later by those who check monthly.
2. Profitability Analytics
Accurately tracks true margins including COGS, FBA fees (Amazon charges 40+ fee types), referral fees, storage, returns, promotional discounts, and PPC spend. Amazon’s margin schedules can change multiple times throughout the year, and if your tool doesn’t update automatically, then your margins can go astray too.
3. Advertising Analytics
Goes beyond ACoS. TACoS is the metric that you need to look at when you are considering your advertising at a business level. An ACoS of 25% is good until you see your organic sales have declined, and TACoS is 40% of sales.
4. Product Performance Analytics
Recognizes your winners and losers by real profitability contribution and not rank of revenue. In many catalogs, a relatively small group of SKUs can account for a disproportionate share of total profit. Many sellers carry products for months that aren’t profitable on a per-unit basis because they don’t focus on SKU-level contribution margin.
5. Operational Analytics
A single dashboard can bring together your P&L, Buy Box percentage, inventory velocity, and session-to-conversion rate for faster daily reviews. The idea is to have one screen that will indicate what is OK and what needs to be addressed today.
Which Amazon Seller Analytics Tools Should You Use?
There is no “one-size-fits-all” solution. The best sellers create a focused stack which is a profit tracker, a PPC optimizer, and a platform that brings everything together in one view for operations. This is an honest list of the major Amazon Seller Analytics tools:
|
Tool |
Best For | Key Strength |
Limitation |
| ProactiveAI | End-to-end eCommerce analytics with AI | Conversational AI, pre-built dashboards, forecasting, self-service | Newer entrant vs legacy tools |
| Helium 10 | Product research and keyword tracking | Massive keyword database, listing optimization | Weaker on P&L depth |
| Jungle Scout | Competitor research and product discovery | Market intelligence, supplier database | Not built for operational analytics |
| SellerApp | PPC optimization and listing health | Keyword indexing, ASIN tracking | Can feel cluttered with features |
| DataHawk | Data-heavy sellers and agencies | Custom reporting, API access | Higher learning curve |
| Sellerboard | Budget-conscious sellers | Clean P&L tracking | Limited advanced analytics |
The most common tools sellers use are a research tool to discover, a P&L platform to manage profitability, and an AI analytics platform to make operational decisions and AI forecasts. Choose tools based on the depth, accuracy, and business relevance of the insights they provide.
How Do You Choose the Right Amazon Analytics Platform?
When choosing an Amazon analytics platform, consider its data accuracy, reporting capabilities, refresh time, marketplace availability, and ease of use. The ideal platform should provide insights from this complex data without hours of manual analysis. Now let’s see what Criteria Should Guide Your Decision.
|
Evaluation Criteria |
What to Look For |
Red Flag |
| P&L Accuracy | Automatically tracks all types of fees and expenses | Collects all costs in a single expense bucket |
| Data Refresh Speed | Information available close to real time or with hourly updates | Daily or weekly “batch” updates |
| Multi-Marketplace Support | A single view across marketplaces and regions | Requires a separate login for each marketplace |
| AI Forecasting | Predictive insights, not just historical reports | Static dashboards only |
| Ease of Use | Can be easily used by the entire team | Requires a data analyst to operate |
| Scalability | Handles an expanding range of products and product lines | Performance slows down as the business scales |
The most critical question to ask any analytics vendor is: “How clearly can your platform show my profit per SKU? They should have a definite answer, and if they can’t, it’s a red flag. Even a 5% reporting error on $500K in annual revenue represents $25K of potentially misreported revenue, highlighting the importance of accurate cost and margin data.
What Are the Best Practices for Amazon Seller Analytics?
The ideal Amazon seller analytics approach merges precise profit information, real-time monitoring, and alerts. Harness SKU-level data, marketplace trends, advertising efficiency, and inventory health for quicker, more profitable decision-making.
1. Check operational metrics daily
Always look at PPC spend, Buy Box percentage, and inventory levels in the morning. Identifying issues early can help limit their financial impact before they compound over time.
2. Review P&L weekly by SKU
Never run your business on a mixed or store margin. Consider contribution margin on a per-product basis. They will almost always have SKUs with very strong revenue that are quietly losing money.
3. Segment by marketplace
It might be profitable to sell a product in the USA but not profitable in Germany because of the FBA fees, VAT rates, and price sensitivity. This is a feature not seen in Blended P&L. Never trust profitability by the marketplace when making pricing and/or advertising decisions.
4. Set threshold alerts
Don’t wait for reports to tell you something went wrong. Set up alerts for when TACoS is greater than 30%, inventory is less than 30 days on hand, and conversion rate falls by more than 10% week over week.
5. Run monthly strategic reviews
Review the SKU rationalization picture once a month – what products are falling and should be withdrawn, and where should you be spending more money? This should be a 30-minute task, not a half-day project, and your analytics platform should make it that easy.
What Makes ProactiveAI Different for Amazon & eCommerce Sellers?
We created ProactiveAI to make it a little easier to work with eCommerce data. We don’t need to trawl through several reports or wait for someone to go to the trouble of pulling numbers out; instead, we can simply ask questions and get clarity from the data.
For instance, if we are interested in products impacted by margin loss or changes in advertising performance, we can request the information instead of building a report from scratch.
We also have easily accessible pre-built dashboards to monitor sales, profitability, advertising, and inventory, as well as forecasting that enables us to understand future demand and plan accordingly.
A crucial component is that teams can examine the data themselves. Marketing, finance, operations, and leadership don’t need to rely on an analyst for all of their information needs.
The objective is simple to make eCommerce data more accessible, understandable, and actionable.
Conclusion
Amazon Seller Analytics isn’t about having more dashboards. It’s about knowing that if it’s a small problem, it needs to be addressed, and you need to act before it becomes expensive.
When revenue is increasing, but margins are slowly decreasing, TACoS is rising, or inventory still relies on spreadsheets, more data might not be the answer. There might be a better way to connect them.
ProactiveAI does just that. ProactiveAI’s suite of AI-powered tools and functionality helps Amazon sellers and eCommerce brands make informed, meaningful decisions. From Conversational AI Analytics, which lets them query their data in plain English, to pre-built eCommerce dashboards, and a forecasting Engine that helps them plan inventory and revenue with confidence.
Looking to really see what’s being said in your data? Schedule a demo with ProactiveAI and gain insights into your Amazon performance in hours, not weeks.
Frequently Asked Questions
What is Amazon Seller Analytics and why does it matter?
Amazon Seller Analytics involves gathering and analyzing your Amazon business data to make informed decisions about your sales, profitability, advertising, and operations. It matters because only Seller Central reports can show you which products are profitable or why performance is changing.
What are the most important metrics in Amazon Seller Analytics?
The most important metrics are contribution margin by SKU, TACoS, Buy Box win rate, return rate, and inventory Days of Supply. These are not limited to sales and show the true health and profitability of your Amazon business.
What is the difference between TACoS and ACoS?
ACoS will be calculated using only ad-driven revenue. TACoS reveals the true impact of ad spend on total business profit by comparing ad spend to total revenue (including organic revenue). TACoS is the more accurate measure for planning purposes.
How often should Amazon sellers review their analytics?
Daily metrics such as PPC spend and Buy Box percentage are important to monitor. Profitability and SKU-level margins are reasons for the weekly review. Use monthly analysis to make strategic decisions like product rationalization, new product launches, and marketplace expansion.
Can Seller Central replace a dedicated Amazon analytics tool?
Seller Central offers raw data exports updated every 24-72 hours and does not include COGS, PPC cost per product, or the impact of returns on profitability. Its features end at around $50K/month, and the dedicated tools fill these gaps to a great extent.
What makes ProactiveAI a strong Amazon Seller Analytics tool?
ProactiveAI integrates conversational AI, pre-built eCommerce dashboards, self-service analytics, and an ML-powered forecasting engine into one platform. This enables your entire team (not only analysts) to make data-driven decisions, monitor performance, and predict demand without facing technical difficulties.
How does AI improve Amazon Seller Analytics?
AI enables natural language querying of your data, automated anomaly detection, and predictive forecasting. You can ask questions and get instant, data-backed answers without building manual reports, saving hours per week and uncovering insights you would otherwise miss.
You might also like
Handpicked articles for your reading list.

Get the latest insights on Conversational AI
Stay ahead of the curve with weekly updates on data analytics, AI trends, and eCommerce growth strategies delivered straight to your inbox.
Join 5,000+ industry leaders. Zero spam, just pure insights.