
 SparxIT
 SPXCommerce
 What's Your A


eCommerce
eCommerce
eCommerce Merchandising Analytics: How Data Drives Better Product Placement and Promotion
-
Vikash Sharma
- Aug 18, 2026
- 10 mins read
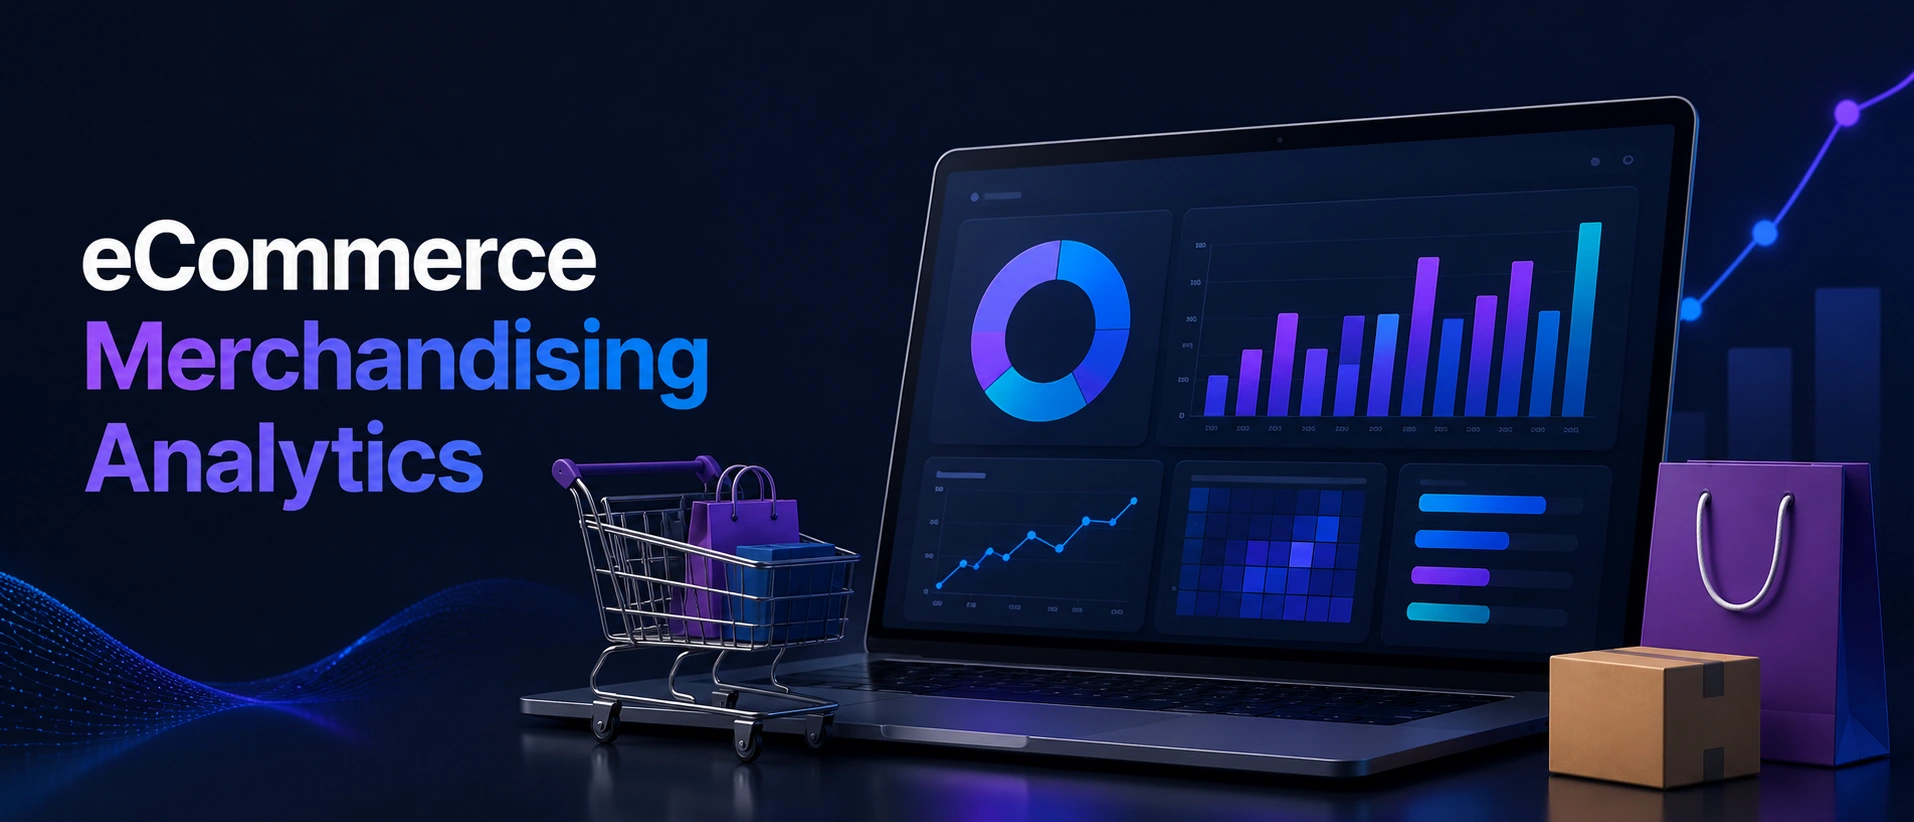
Thousands of products may be live across your ecommerce store, creating complex merchandising decisions at scale. You have developed category pages, product descriptions, set up homepage banners, and configured the recommendation carousels. Yet some products receive little visibility, some category pages lose valuable traffic, and some homepage hero slots fail to support commercial goals. These are the problems most eCommerce teams deal with day-to-day when making decisions and assessing whether those decisions are actually effective.
Ecommerce merchandising analytics changes that by connecting customer behavior with product placement decisions. Linking behavioral data to the decision about where to place products ends the guessing game and begins optimization. Each merchandising slot can become a measurable test of product placement and performance. Each placement, each sort order, each featured collection can be measured, adjusted, and improved.
This blog explains how merchandising analytics works, what metrics are really important, and how AI tools provide eCommerce teams with the clarity they need to make quick decisions.
What Is eCommerce Merchandising Analytics
eCommerce merchandising analytics involves analyzing customer behavior and transactions. Along with the context to inform the strategy for product placement and how products are ranked, featured, and promoted throughout an online store.
It’s the data foundation for all visual merchandising decisions. Which products appear first in a category? What are the criteria for featuring a product in a homepage hero slot? What does the “You Might Also Like” carousel display? These are educated guesses if they’re not backed by analytics. Analytics gives them informed choices based on click rates, conversions, revenue per position, and scroll depth.
Companies that leverage data-driven personalization in merchandising experience revenue gains of 5-15% and marketing efficiency gains of 10-30%, says McKinsey. These gains can materially influence revenue performance and marketing efficiency during high-volume periods.
Digital merchandising analytics spans a wide range, from page layout and product sort logic to homepage performance, search results rankings, and the recommendation engine’s output. All of these areas produce unique, usable information.
How Do Category Pages Reveal Merchandising Gaps?
Category page performance is one of the strongest and most underutilized indicators of ecommerce performance..
A consumer arriving on a category page has a split-second choice to scroll, click, or leave. What they do next provides valuable signals about whether your merchandising strategy is working.
On category pages, important indicators to monitor:
- CTR by position: Which positions receive clicks and which product positions receive limited visibility?
- Scroll depth: How far down the page shoppers actually go?
- Add to cart rate per product: The percentage of products that move shoppers from browsing to adding an item to the cart.
- Exit rate: Are visitors leaving the category without interacting with anything?
- Revenue per category visit: The ultimate efficiency metric
If your top three products receive 70% of category clicks but generate only 20% of revenue, the placement strategy may not be directing shoppers toward the most commercially valuable products. It’s a merchandising issue, not a traffic issue.
This sort of analysis is commonplace using product placement analytics for eCommerce. Instead of rotating products based only on margins or new arrivals, teams can optimize placement using clicks, conversions, revenue, and other performance signals..
As an example, let’s assume a fashion brand was optimizing its “New Arrivals” sort and realized that the top-selling items were being pushed to the third page. Once the logic was changed to a data-driven approach based on conversion rate and revenue per impression, category revenue rose by 18% after six weeks.
What Does Site Search Data Tell You About Your Catalog?
One of the most underutilized sources of data in merchandising is eCommerce site search analytics. The search bar is essentially your shoppers telling you exactly what they want in their own words.
According to the data from the website search, it is found that. Zero-results queries: Products or categories that you don’t carry, or different names for the same product in your catalog
- High-search, low-purchase terms: Products that people are searching for but not purchasing (pricing? product page gaps? quality?)
- Conversion rates from search results to purchases: Will your search results actually be the ones that are converting to sales?
- Query reformulations: When shoppers rephrase a search, it usually means the first results failed them
The merchandising implication is straightforward. When you see the keyword “sustainable packaging” 400 times a month and have a 4% conversion rate, you have a content and placement gap. When “gift sets” is a seasonal category that’s trending toward the top of your list every November, but your category page is buried in the middle or bottom, it’s a good merchandising idea you’re not making.
Ecommerce sorting and filtering analytics is another of the many analytics elements that benefit directly from strong site search analytics. The way your users narrow down search results (by price, size, color, or rating) gives you clues about what matters to them when considering your product. That data should drive both your filter UI and default sort order.
How Do You Measure Homepage and Collection Page Performance?
The first page of your website is valuable real estate. Each and every pixel that appears above the fold is vying for attention, and the misplacement of these can lose you revenue without you even knowing what happened.
When implementing eCommerce home page analytics, it is important to see which banners, featured products, and promotion slots are actually getting clicks to downstream purchases. Not only impressions, but qualified engagement leading to a transaction.
What to measure:
| Metric | What It Tells You |
| Banner click-through rate | Whether your creative and placement match what visitors want |
| Hero slot conversion rate | How effectively the featured product drives purchase intent |
| Scroll-to-secondary sections | How many visitors see content below the fold |
| Section-attributed revenue | Which homepage blocks generate actual sales |
| Device-split performance | Whether mobile vs. desktop visitors behave differently |
The framework of collection page analytics is similar, but it has the additional element of curation intent. Every collection, such as “Summer Essentials” or “Back to School,” has a promise to it as an editor. Analytics can give you insight into whether the products you’ve curated actually live up to that promise, or whether visitors are leaving because the curated selection isn’t what they expected.
Often overlooked: Seasonal collection pages can beat evergreen category pages for conversion rate when their creation is data-driven. When creating a “Holiday Gifts” collection from last year’s successful items, you may be overlooking this year’s hot sellers.
What Metrics Should You Track for Product Recommendations?
Product recommendation analytics is a cross-cut between personalization and merchandising. But only as good as the data that they are trained on, and only as useful as the metrics that you use to measure their results.
The Key Performance Indicators of recommendations are:
- Recommendation click-through rate (CTR): Do customers click on the products that you are recommending?
- Recommendation-attributed revenue: Percentage of total revenue that comes from clicks on recommendations
- Average order value (AOV) lift: Do visitors that click on recommendations end up spending more money?
- Diversity score: Are recommendations pulling from a narrow slice of your catalog or giving exposure to a wider range?
- Recency bias check: Are new products being promoted, or are they the engine’s historical bestsellers?
Many people make the mistake of optimizing recommendations solely for CTR. If the CTR of the recommended products is high, the algorithm is most likely showing the customer products he/she would have seen in the store anyway, a non-value-added situation. A better measure is recommendation-incremental revenue, such as revenue generated from a sale that wouldn’t have happened otherwise.
This is where the combination of the behavioral data and inventory/margin data becomes interesting. A recommendation that surfaces a high-margin product to a shopper with a demonstrated preference for that category is worth more than a generic “bestsellers” block even if the click rate looks similar.
What KPIs Actually Matter in Digital Merchandising?
There are not all eCommerce merchandising KPIs. Traffic and sessions are information about acquisition. Bounce rate is an indicator of landing experience. However, merchandising-specific KPIs are more precise, and they track the effectiveness of your product presentation in driving the move from browsing to buying.
The key merchandising stack of KPI:
Visibility metrics
- How many times each product is viewed (impressions per product)
- The percentage of the catalog that is read per session.
- Position weighted click rate (CTR per position)
Engagement metrics
- Product detail page (PDP) visits per category visit.
- Time on product page vs. bounce rate
- Add to wishlist rate (softer intent signal for trend spotting purposes)
Conversion metrics
- Category-to-cart conversion rate
- Search result page conversion rate
- The percentages listed above are the conversion rates for each placement type.
Revenue metrics
- The most direct measure of placement efficiency is revenue per product impression (RPPI)
- The revenue per position after subtracting the margin.
- Promotional slot ROI
What makes merchandising teams good at optimizing for real results rather than activity is the metrics they use: vanity metrics vs. efficiency metrics.
How Does Visual and Sorting Logic Affect Conversion?
In eCommerce, visual merchandising analytics is not just about where products are located but also about how they look. At the product tile level, factors such as image quality, video availability, badge labels (e.g., “Bestseller” or “Low Stock”), and price display all affect click-through and conversion rates.
The test methods to consider for implementation:
- Labels showing the bestseller, customer favorite, or none (A/B test)
- Compare lifestyle imagery at the product level with white-background product imagery at the tile level.
- Compare the effect of hiding price vs. hiding it from category grid views.
- Measure click-through performance for lower-rated products with different star-rating displays.
In terms of sorting logic specifically, one of the highest-leverage eCommerce merchandising levers is the default sort order. Most platforms default to ‘featured’ or ‘new arrivals’, but neither is necessarily the best for conversion.
eCommerce sorting and filtering analytics can answer: What sort is the most profitable in terms of revenue per visit by category? In cases of some categories, sorting by conversion rate is the best approach. Others sort by margin or by the product of the number of reviews and the average rating (social proof). It varies by category, audience segment, and time of year, so testing and measuring are more helpful than a one-size-fits-all approach.
How Does AI Analytics Improve Merchandising Decisions?
Manual merchandising analysis is time-consuming. A category manager spending two days looking at heatmaps, exporting CSV sales data, and cross-referencing spreadsheet information may take two minutes to answer a question. By that time, the opportunity will have passed.
This is where conversational AI in eCommerce analytics steps in. Merchandising teams can pose the data questions directly in plain English, and receive answers within seconds, without sending them down an analyst queue.
Using Conversational AI Analytics, a category manager can ask:
- What are the top-performing Women’s Footwear products in terms of impression-to-cart ratio this month?
- Which browser banner slot has the highest weekly income by device type?
- What search queries were there on the site that didn’t return any results over the past month?
The platform integrates directly with your data sources, understands eCommerce jargon, and delivers accurate, visualization-ready responses without SQL expertise or analyst handoffs. It comes in handy when teams have to make quick decisions, especially during the busy season, when waiting 48 hours for a report is not a viable option.
eCommerce analytics dashboard also provides pre-built sub-dashboards of key metrics that are relevant to a team, such as category performance to recommendation attribution, which require no dashboard configuration.
What Is the Role of Forecasting in Merchandising Planning?
Merchandising analytics is more than just a conversation about “what happened”; it’s about predicting “what is next?” eCommerce sales forecasting empowers merchandising teams to showcase products. Along with this, it offers promotional opportunities based on its demand predictions rather than on past actions.
For instance, if you have a forecasting model that predicts outdoor furniture will rise 40% over the next 3 weeks. Then you can act on that signal today by prioritizing outdoor furniture on the homepage, showing outdoor furniture products in product recommendation blocks, and ensuring that products with high inventory counts are ranked near the top of the relevant category.
The Forecasting Engine by ProactiveAI is designed to provide forward-looking signals for the business at the product and category levels, using predictive analytics powered by a machine learning engine. This sort of proactive planning integrates your analytics environment with operational planning in a manner that reactive reporting can’t.
Conclusion
“Great merchandising is not about promoting more products, and it’s about promoting the right products in the right place at the right time.” Each component of your homepage banner, ranking, search results, and every single recommendation widget can shape customers’ discovery of products and impact whether people purchase.
eCommerce merchandising analytics provides teams with the visibility to prove their impact, uncover their failures, and continually improve each and every merchandising decision, without relying on assumptions.
Retailers can use relevant KPIs to track and measure the success of their marketing strategies and analyze customer and search behavior. This helps you optimize product placement and leverage AI-powered insights and forecasting to deliver more relevant shopping experiences for your customers and more profitable outcomes for their business.
With increased competition in eCommerce, the brands that survive will not be the ones who have the largest catalogs, and they will be the ones that make the right merchandising decisions- and that’s through data.
Having the right analytics platform makes merchandising a continuous optimization process that teams can use to boost product visibility, conversion rates, revenue, and outpace shifting customer demand.
Frequently Asked Questions
What is eCommerce merchandising analytics?
eCommerce merchandising analytics involves analyzing behavioral and transactional data to inform product placement, ranking, highlighting, and promotion in an online store. It transforms editorial recommendations into data-driven, actionable actions that drive sales and optimize options.
How do you use analytics to decide which products to feature?
You can measure position-weighted click rate, revenue per product impression, and add-to-cart rates for each placement slot. When products convert well relative to their current location, promote them; when conversion is poor, even in prime real estate, replace them with data-validated products and test before making any changes.
What metrics reveal whether your category pages are performing well?
Unarguably, the most significant metrics are the conversion rate of categories to cart, the click-through rate (CTR) by position, how far down the page users scrolled, and the revenue per category visit. High-traffic categories that are low-converting are generally sorted by order, product selection, or filtering. Analytics can diagnose and resolve these issues directly.
How does site search analytics improve eCommerce merchandising?
Site search logs provide the exact products consumers are looking for that aren’t available on your website. The zero-result queries reveal gaps in the catalog, the high-search/low-purchase queries indicate product-page or pricing problems, and the query reformulations indicate that search results are not meeting shoppers’ expectations. All this influences smarter product placement and catalog decisions.
How do product recommendation engines use analytics data?
Recommendation engines analyze co-purchase data, click sequences, and product similarity signals to surface relevant products. Analytics measures whether or not those suggestions lead to incremental revenue, not simply clicks on products that the shoppers would have seen without those suggestions, and feeds that back into the algorithm to make better recommendations.
You might also like
Handpicked articles for your reading list.


Get the latest insights on Conversational AI
Stay ahead of the curve with weekly updates on data analytics, AI trends, and eCommerce growth strategies delivered straight to your inbox.
Join 5,000+ industry leaders. Zero spam, just pure insights.