


eCommerce
eCommerce
Average Order Value (AOV): What It Is and How to Increase It
-
Vikash Sharma
- Jun 03, 2026
- 9 mins read
You doubled your traffic last quarter. Conversion rates held steady. But revenue barely moved. That gap has a name. It sits between traffic growth and revenue growth, and most store owners never measure it directly. It is called average order value, and fixing it is often faster than chasing new customers.
According to Dynamic Yield’s April 2026 ecommerce benchmark report, the global AOV was approximately $172. As per Shopify benchmark data, the median store generated an AOV of $74.12 across paid channels. That gap is not a coincidence. It shows how much room many ecommerce brands still have to grow order value.
This guide covers AOV meaning, how to calculate it, what a good AOV looks like by industry, common mistakes that drag it down, and seven strategies that move the number up without killing your margins.
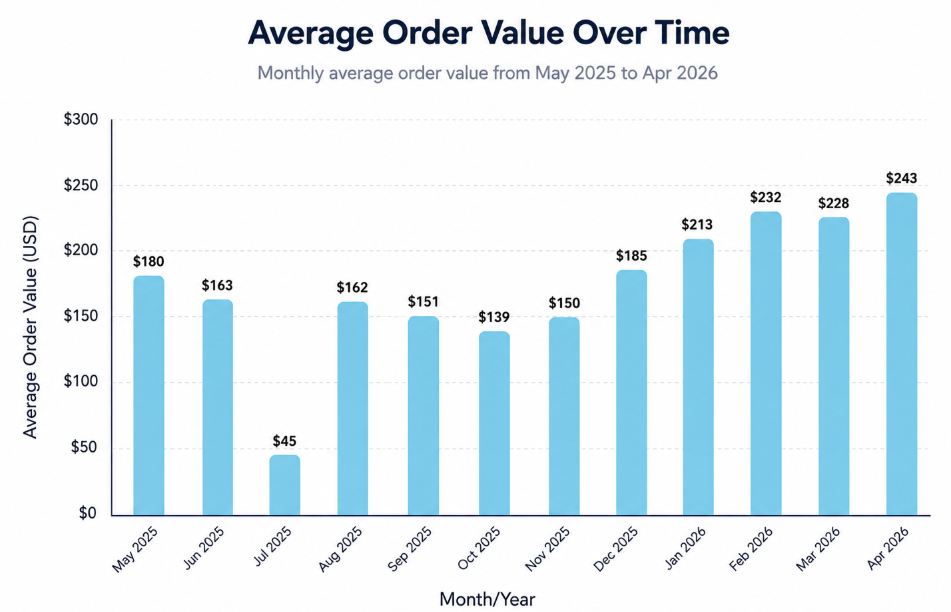
Image Source: Dynamic Yield
What Is Average Order Value (AOV)?
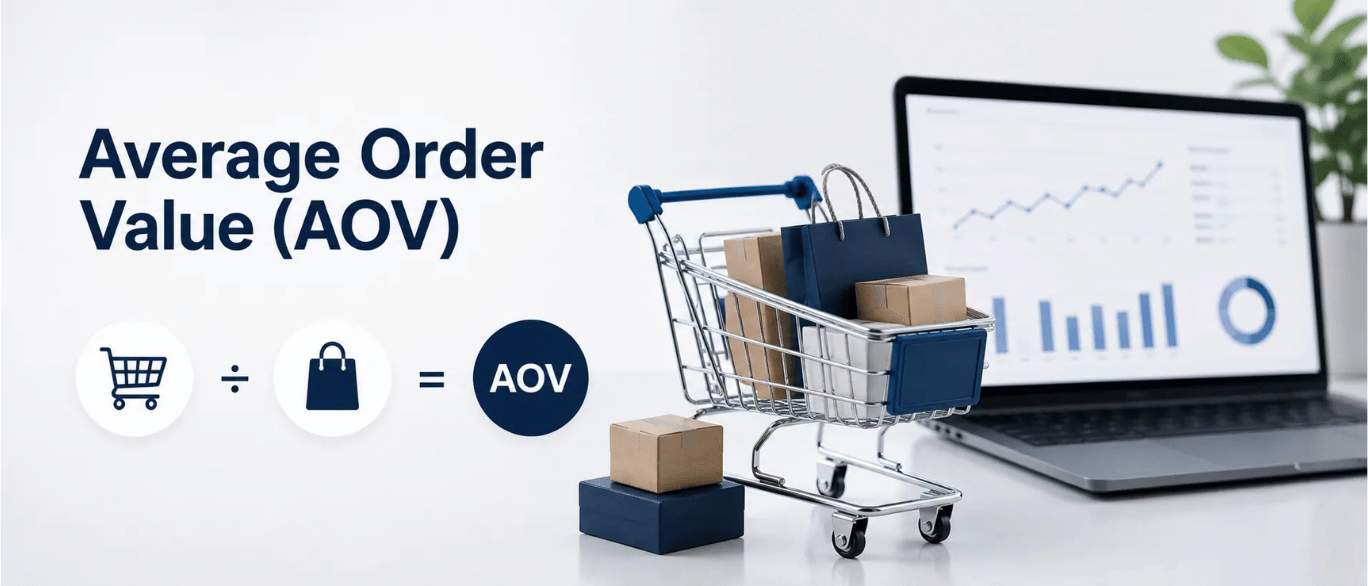
Average order value (AOV) is an eCommerce metric that measures the average dollar amount a customer spends per order placed through a website or a mobile app. It remains one of the top eCommerce metrics for evaluating revenue efficiency.
Ecommerce businesses use it to understand purchasing behavior, evaluate revenue performance, and identify opportunities. This helps them to increase sales without acquiring more customers.
AOV tells you how much customers spend when they do buy, not how often they buy or how many convert. In AOV ecommerce, most brands track AOV monthly, while tracking it weekly during promotions provides faster insights.
Note: It does not measure loyalty. It does not measure traffic. It measures the size of each transaction.
How to Calculate Average Order Value
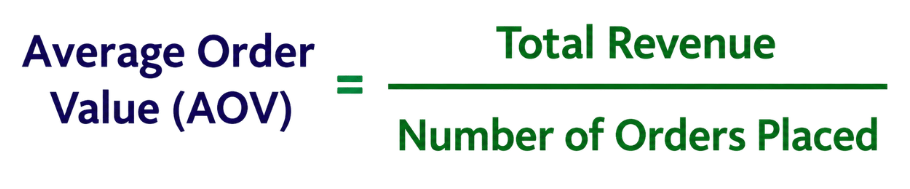
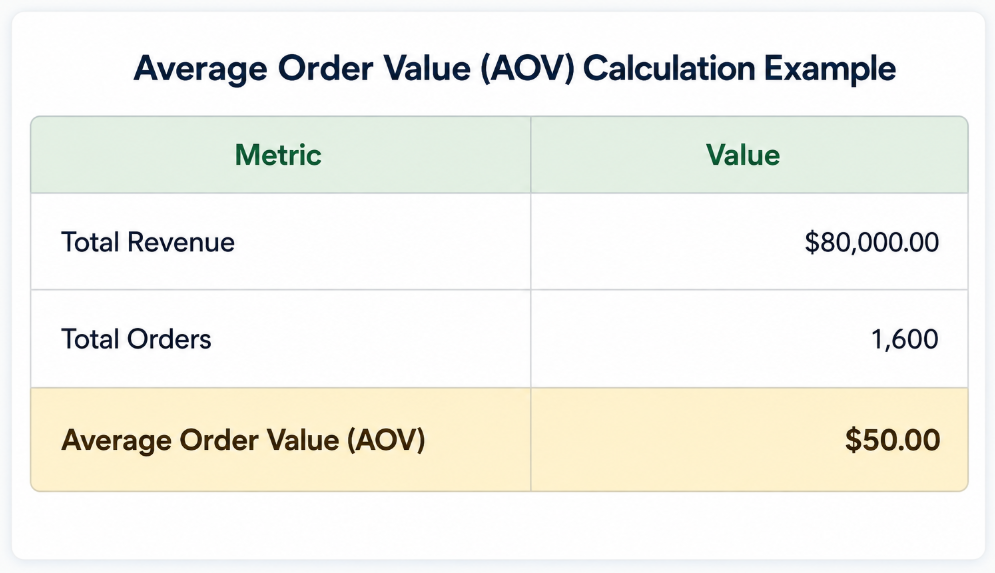
Calculating average order value is straightforward. Divide your total revenue by the total number of orders during a specific period. The result shows the average amount customers spend per transaction. The average order value formula is:
eCommerce AOV Calculation Example
Your store generates $80,000 in a month from 1,600 orders. Divide $80,000 by 1,600. Your AOV is $50.
- AOV = Total Revenue ÷ Total Orders
- AOV = $80,000 ÷ 1,600
- AOV = $50
This means that, on average, each customer order was worth $50.
We’ve also created an Excel file with the calculation and formula:
Note: To calculate the average order value in Shopify, go to Analytics, select your date range, and locate the Average Order Value card. It runs the calculation automatically. In Google Analytics 4, look under Ecommerce purchases as ‘Average purchase revenue.’
| One thing to watch: Exclude canceled orders and returns from your numerator unless your platform handles this automatically. Inflated revenue figures produce a false AOV. |
Why does Average Order Value Matter?
Getting more traffic costs money. Every paid click, every influencer post, every SEO effort adds to your customer acquisition cost. Increasing AOV costs almost nothing by comparison.
If you spend $30 to acquire a customer who spends $60, your unit economics work at a 2x return. If that same customer spends $90 because you added a bundle or a free shipping threshold, your return jumps to 3x with no additional ad spend.
That is why tracking average order value benchmarks should be part of every weekly revenue review, alongside conversion rate and revenue per visitor.
Average order value is also directly linked to profitability because most order-processing costs are fixed. Packaging, shipping, and payment processing fees do not scale linearly with order size. A higher-value order absorbs those fixed costs more efficiently.
What Is a Good AOV?
There is no universal number for a “good” Average Order Value (AOV), but the global cross-industry benchmark hovers around $145.
Ultimately, a good AOV is any amount that comfortably covers your Customer Acquisition Cost (CAC) and operational overhead while yielding a sustainable profit margin.
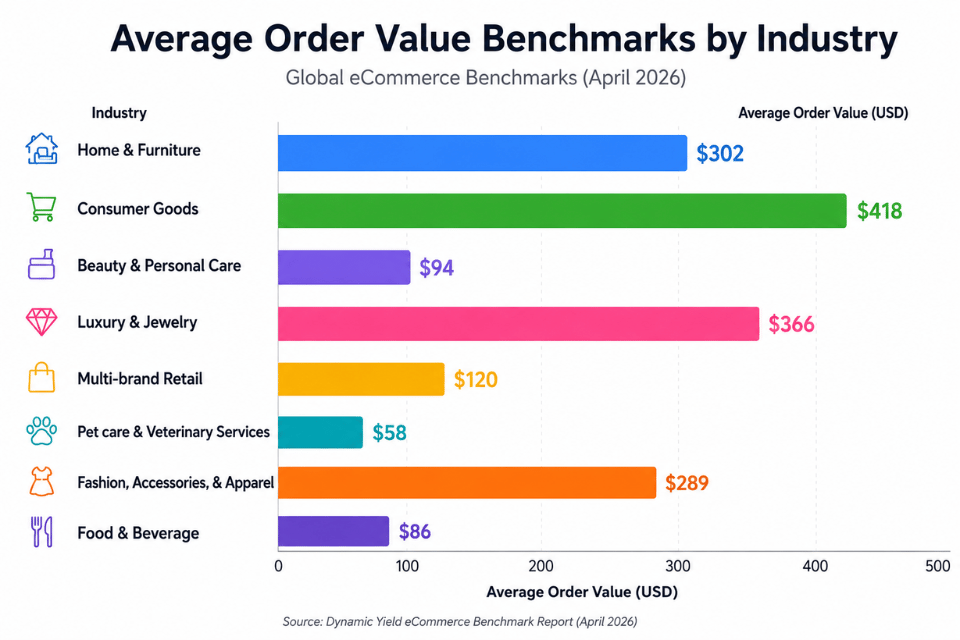
Ideally, your AOV should be at least 1.5x to 2x higher than your CAC. Because product prices differ wildly, a healthy AOV depends heavily on what you sell. Here is the global ecommerce AOV data for different categories:
Segment AOV to Understand Customer Behavior
A store-wide AOV provides a starting point, but a segmented average order value reveals the insights needed for data-driven decision making.
Breaking AOV down by customer type, channel, and product category reveals patterns that a blended metric often hides. Many brands also use RFM analysis to identify which customer segments generate the highest order values.
-
New vs. Returning Customers
Returning customers almost always have higher AOV. They know your catalog, trust your brand, and are more likely to add complementary products. Strong customer retention helps brands increase repeat purchases. If your new customer AOV is significantly lower, that is a cross-sell problem at the first purchase stage.
-
Traffic source
Email-driven buyers typically have a higher average order value than social traffic. Organic search tends to land in the middle. If your paid social AOV is below your free shipping threshold, your ad creative may be attracting single-item buyers.
-
Product category
Which categories anchor high-AOV orders? Which ones produce mostly single-item carts? Identifying your hero product can help you build stronger bundles, cross-sell recommendations, and upsell strategies around that item.
-
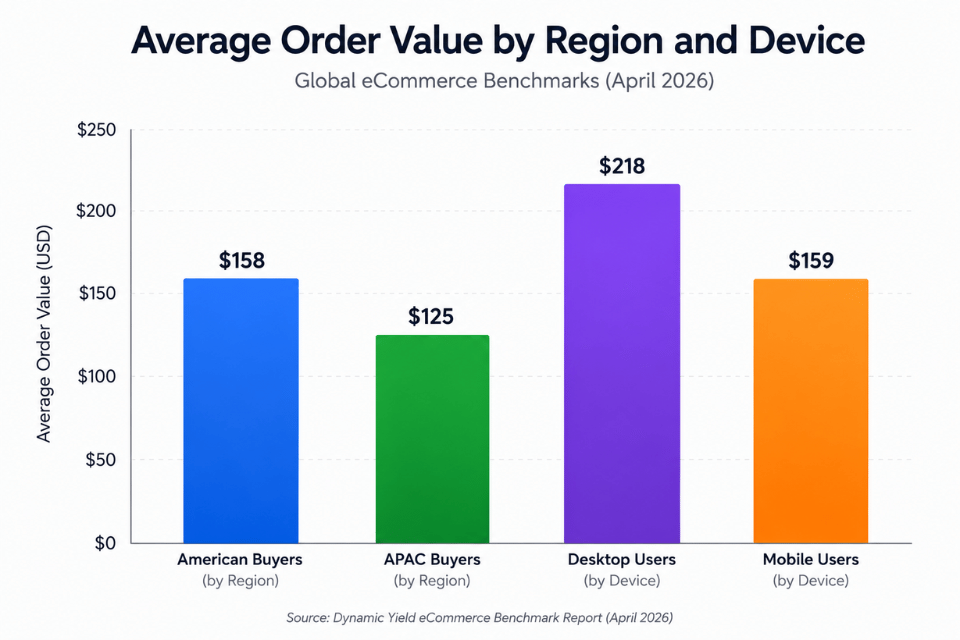
Geography
According to dynamic yield, American buyers average $158 per order. APAC buyers average $125. If you ship internationally, blanket free shipping thresholds set to a single regional average will underperform in other regions.
-
Device
Desktop users spend $218 on average. Mobile users spend $159. A large share of mobile traffic with a high cart abandonment rate suggests friction in the mobile purchase flow, not necessarily a low-intent audience.
Run these segments monthly. The patterns shift with seasons, campaigns, and catalog changes. Watching the trend is more useful than any single snapshot.
How to Interpret and Analyze AOV Effectively
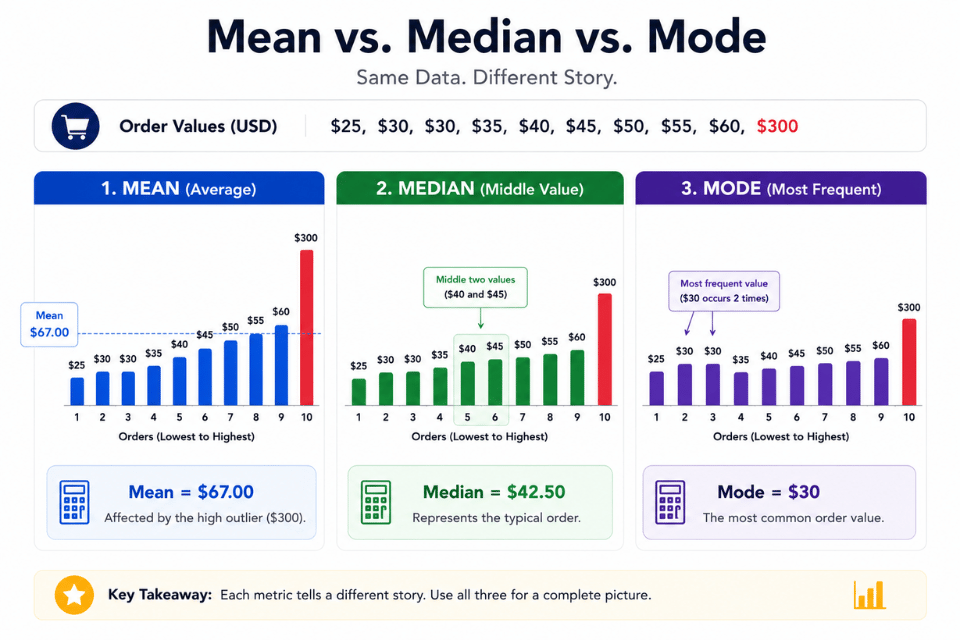
Most stores track a single AOV metric, but that number rarely tells the full story. To truly understand your order-value patterns, you need three lenses: mean, median, and mode. Let’s know about them one by one below:
-
Mean (the standard AOV)
This is total revenue divided by total orders. It is the number most dashboards show. A few unusually large orders can inflate the mean, making average customer spending appear higher than reality.
If one wholesale buyer drops a $2,000 order in a month of mostly $40 purchases, your mean AOV climbs without anything really changing for your core customers.
-
Median
Sort all your orders from lowest to highest and find the middle value. This is more resistant to outliers. If your mean AOV is $95 but your median is $52, you have a small group of high-value customers distorting the headline number. Most customers are spending far less than the mean suggests.
-
Mode
The order value that appears most often. This shows you what your customers spend the most on. If the mode is $29.99, your $75 free-shipping threshold is probably too high for most buyers to meet.
Note: Use the mean to track the trend direction. Use the median to understand your typical customer. Use mode to set thresholds and bundle price points.
Comparing all three in a single report takes about 5 minutes in any eCommerce analytics dashboard. When the mean and median diverge significantly, that is a signal to segment your data and examine who is driving the gap.
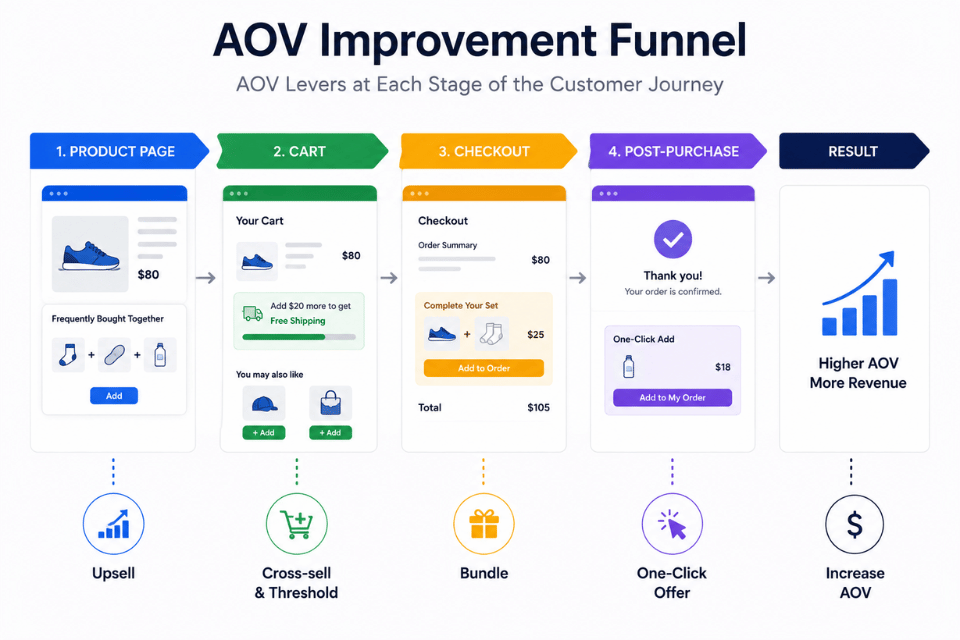
How to Increase Average Order Value: 7 Proven Strategies
Knowing how to increase average order value starts with understanding what drives the purchase decision at checkout.
-
Set a Free Shipping Threshold
For many ecommerce stores, this is one of the most effective ways to increase AOV. Customers add items to cross a visible threshold. A store with a $60 AOV and free shipping at $75 will see basket growth because the math is visible to the buyer.
Many ecommerce brands set their free shipping threshold 20-30% above their current AOV to encourage larger carts. To improve average order value Shopify-style, go to Settings > Shipping and Delivery and configure the minimum order value for free shipping.
-
Bundle Products
Bundles shift the decision from ‘should I buy this one thing?’ to ‘which bundle works for me?’ That reframe increases perceived value and tends to raise units per transaction.
Build bundles around natural use cases. A skincare brand bundles cleanser, toner, and moisturizer. A pet store bundles food, a chew toy, and treats. A simple way to build bundles is to identify products that customers frequently purchase separately.
-
Cross-Sell at Cart and Checkout
Cross-selling shows customers what pairs well with what they are already buying. Suggest complementary items under 30% of the cart total. Larger recommendations may feel less relevant and can reduce engagement.
-
Upsell with a Better Version
Upselling offers a premium version of what the customer already chose. The customer decided they want the product. The upsell asks whether they want the better one.
Messages such as “This version includes X and Y for $15 more” often perform better than generic upgrade prompts.
-
Volume Discounts and Tiered Pricing
‘Buy 2, save 10%’ works because the math is transparent. Customers who were going to buy one unit consider whether the savings justify buying three.
Volume discounts boost AOV by increasing the number of units per order without requiring you to acquire a new customer.
-
Loyalty Programs and Spend Milestones
Points-based loyalty programs create a reason to spend more per order. ‘Spend $100 to earn double points’ is a soft incentive. ‘Spend $100 and unlock free shipping for 30 days’ is a harder one.
Segment this by customer type. High-frequency buyers respond to points. Occasional buyers respond better to immediate threshold rewards.
-
Post-Purchase Upsells
After checkout, before the confirmation page fully loads, offer a one-click add-on. The customer just pulled out their card. Buying intent is at its peak.
| Research from Cornell shows one-click checkout options increase average spending by up to 28.5%. Even a fraction of that improvement matters at cale. |
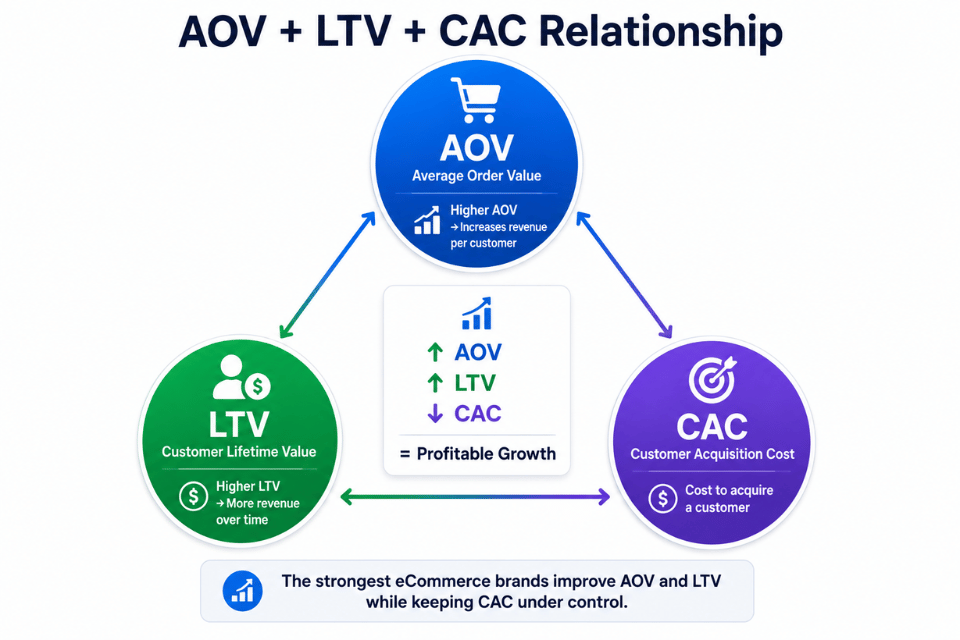
How AOV Works with Other Ecommerce Metrics
AOV becomes more valuable when analyzed alongside other ecommerce metrics. Its real meaning lies in how it sits alongside three other numbers that every ecommerce brand should track together.
-
AOV and Customer Lifetime Value (LTV)
LTV = AOV multiplied by purchase frequency, multiplied by customer lifespan. A higher AOV directly raises lifetime value and improves customer CLV without requiring more purchases. If you can move AOV from $60 to $75, LTV improves even if the customer buys the same number of times.
-
AOV and Customer Acquisition Cost (CAC)
The formula that matters is (AOV x Purchase Frequency) / CAC. AOV strategies that rely on deep discounting to inflate order size will compress margins and undermine this ratio. AOV growth should come from genuine value: bundles, better recommendations, and well-placed thresholds.
-
AOV and ROAS
Return on ad spend measures revenue generated per dollar of ad spend. Many marketers use AOV to calculate ROAS more accurately and evaluate campaign profitability.
If your paid campaign drives 100 orders and AOV goes from $50 to $65, ROAS improves by 30% with no additional spend. This is why media buyers should evaluate AOV alongside ROAS for a more complete view of performance.
For planning, revenue forecasting models that factor in historical AOV trends help set realistic revenue targets for seasonal promotions and new product launches. You stop guessing what a 10% AOV lift is worth in dollar terms.
Tools to Track and Optimize Average Order Value
The right tools make the difference between watching AOV as a monthly number and actually understanding what moves it.
-
Shopify Analytics
Built-in AOV tracking with date range filters. Good for basic monthly trend tracking. Limited when you need channel-level or segment-level breakdowns.
-
Google Analytics 4
Tracks AOV as ‘Average purchase revenue’ under Ecommerce. Strong for source/medium segmentation. Requires some configuration to get accurate ecommerce data.
-
ProactiveAI
Combines conversational AI analytics and querying, pre-built dashboards, and forecasting in one platform. Let’s you ask natural-language questions about AOV without creating manual reports.
Teams without dedicated analysts often benefit from self-service analytics tools. These tools help marketers and merchandisers explore AOV by channel, product, and customer segment.
Track AOV in Real Time With ProactiveAI
Monthly spreadsheet tracking shows your AOV, but identifying the factors behind changes requires deeper self-service data analytics.
ProactiveAI helps teams move beyond static reports by turning AOV analysis into a continuous process. Instead of manually digging through dashboards, you can identify which products, channels, customer segments, and campaigns are influencing order value in real time.
With self-service analytics, conversational querying, and automated insights, teams can quickly find opportunities to increase AOV and make faster, data-backed decisions.
The Bottom Line
Average order value directly influences revenue growth and profitability. Pushed in the right direction, it grows revenue without adding a single new customer to your acquisition funnel.
Start with your benchmark. Know what AOV looks like in your category. Then pick one or two strategies that fit your customer base and test them. Free shipping thresholds and bundles can produce results quickly. Post-purchase upsells take more setup but have outsized returns.
Analytics tools that connect AOV to channels, customer segments, and seasonal trends help distinguish temporary gains from sustainable growth.
Frequently Asked Questions
What is a good average order value for ecommerce?
It depends on your category. Global AOV averages $150. Beauty brands aim for $67- $ 90. Luxury brands exceed $300. Compare against your specific industry, not the global number.
How do you calculate average order value?
Divide total revenue by total number of orders. Average order value formula: AOV = Total Revenue / Total Orders. Exclude returns and cancellations for accuracy.
What tactics increase AOV the most?
Free shipping thresholds and post-purchase one-click upsells move AOV fastest. Product bundling and volume discounts produce consistent, sustainable lifts without margin erosion.
How does AOV relate to ROAS and profitability?
AOV multiplies ROAS directly. Higher AOV means more revenue from the same ad spend. But margin matters: AOV gains from deep discounting can improve ROAS while hurting net profit.
You might also like
Handpicked articles for your reading list.

Get the latest insights on Conversational AI
Stay ahead of the curve with weekly updates on data analytics, AI trends, and eCommerce growth strategies delivered straight to your inbox.
Join 5,000+ industry leaders. Zero spam, just pure insights.