
eCommerce
AI & Analytics
RFM Analysis: How to Identify Your Best Customers and Grow Revenue Faster
-
Varun Kumar
- Jun 01, 2026
- 13 mins read

Key Takeaways
|
Most businesses treat all customers the same. That is one of the most expensive mistakes in marketing. You send the same email to your biggest spender and to someone who bought only once two years ago.
You run the same ad to a loyal buyer and to a customer who has almost churned. The result? Wasted budget, low engagement, and missed revenue. RFM analysis solves these bottlenecks. It helps you understand who your best customers really are, using only the data you already have.
In this guide, you will learn what RFM analysis is, how to calculate an RFM score from scratch, how the RFM model powers smarter customer segments, and how businesses use it for revenue forecasting.
What is RFM Analysis?
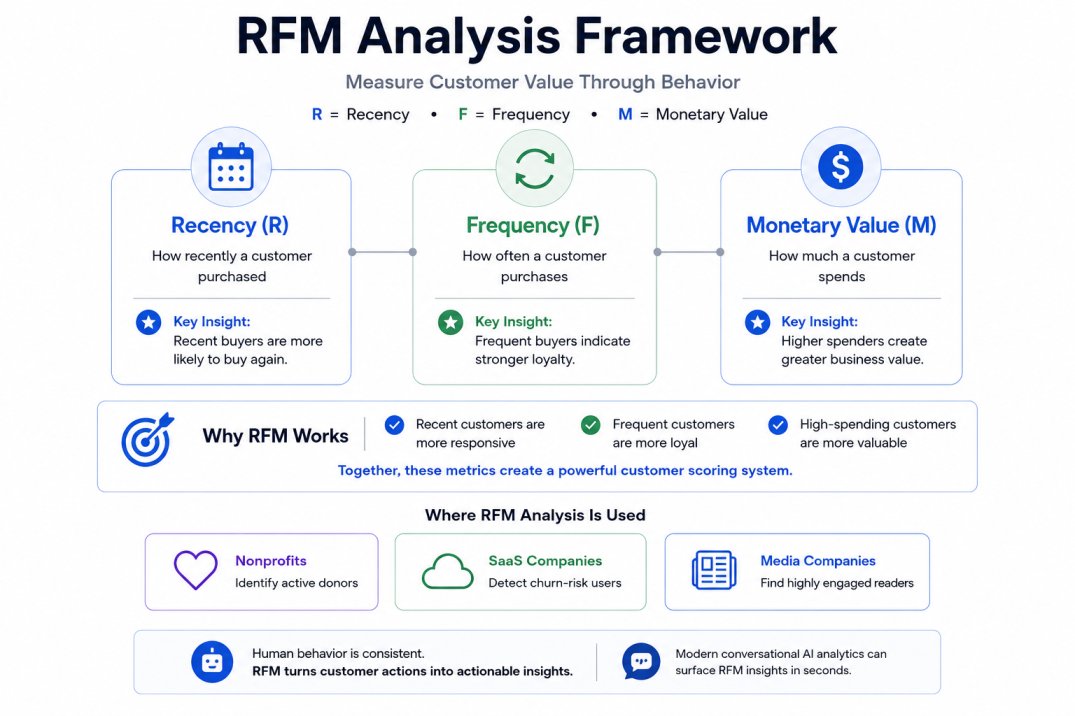
RFM analysis is a customer scoring technique built on three behavioral signals: Recency, Frequency, and Monetary Value. Together, these three dimensions form the RFM model and give you a picture of how recently a customer bought from you, how often they buy, and how much they spend.
The concept originates from a 1995 paper by Arthur Hughes, who applied it to direct mail marketing. The idea was simple: customers who have bought recently are more likely to buy again. Customers who buy often are more loyal. Customers who spend more are more valuable. Hughes combined all three into a scoring system. Thirty-one years later, the logic still holds.
The use case for RFM analysis is not limited to the ecommerce industry. It is also for:
- Nonprofit organizations to find their most active donors.
- SaaS companies to spot users about to churn.
- Media companies to identify their most engaged readers.
The framework is flexible because human behavior is consistent. And when you pair it with tools like conversational AI analytics, you can surface these insights in seconds by simply asking your data a question.
| Expert Insight: According to the Pareto Principle (also known as the 80/20 rule), 80% of a business’s revenue typically comes from 20% of its customers. RFM analysis is the fastest way to identify who those 20% are. |
The Three Pillars of RFM: Recency, Frequency, and Monetary Value
Understanding each dimension of recency frequency monetary value is the foundation of any reliable RFM analysis. Let us break each one down.
Recency: When Did They Last Buy?
Recency measures the number of days since a customer’s last purchase. A customer who bought yesterday is far more likely to buy again than one who bought 18 months ago.
Recency is the strongest predictor of future purchases. If you had to choose only one variable from the RFM model, this is the one.
Frequency: How Often Do They Buy?
Frequency measures the number of purchases a customer has made over a defined period, usually 6 to 12 months. A customer who has made 10 orders is a different kind of customer than someone who has made 2.
High-frequency customers have demonstrated a habit. They trust you. They have integrated your product or service into their routine. These are your loyalists.
Monetary: How Much Do They Spend?
Monetary value captures the total revenue a customer has generated over the measurement period. A customer who has spent $2,000 should receive different treatment than one who has spent $50.
Not because the $50 customer is less important, but because the $2,000 customer represents a disproportionate share of your revenue. They deserve disproportionate retention efforts.
Real-World RFM Analysis Example
Let us walk through a real example of RFM analysis to show how this works in practice.
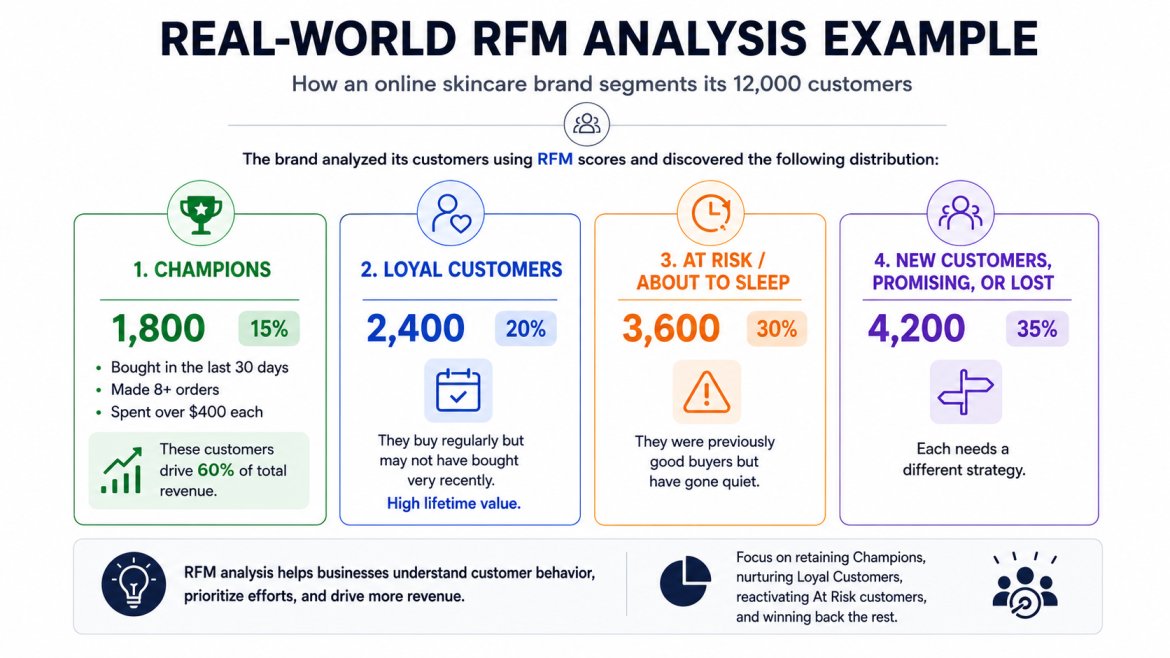
Imagine an online skincare brand with 12,000 customers. They run their RFM scores and discover the following distribution:
- 1,800 customers (15%) are Champions. They bought in the last 30 days, have made 8+ orders, and spent over $400 each. These customers drive 60% of total revenue.
- 2,400 customers (20%) are Loyal Customers. They buy regularly but may not have bought very recently. High lifetime value.
- 3,600 customers (30%) are At Risk or About to Sleep. They were previously good buyers but have gone quiet.
- 4,200 customers (35%) are New Customers, Promising, or Lost. Each needs a different strategy.
With this picture, the brand does not send one generic email. Instead, they send five different campaigns on the same day:
- Champions get an exclusive ‘VIP early access’ message for a new product launch.
- Loyal Customers receive a loyalty reward with a points bonus.
- At-Risk customers receive a time-sensitive ‘We miss you’ offer with 15% off.
- New Customers get a product education series to build habits.
- Lost Customers receive a final re-engagement email before being removed from the list.
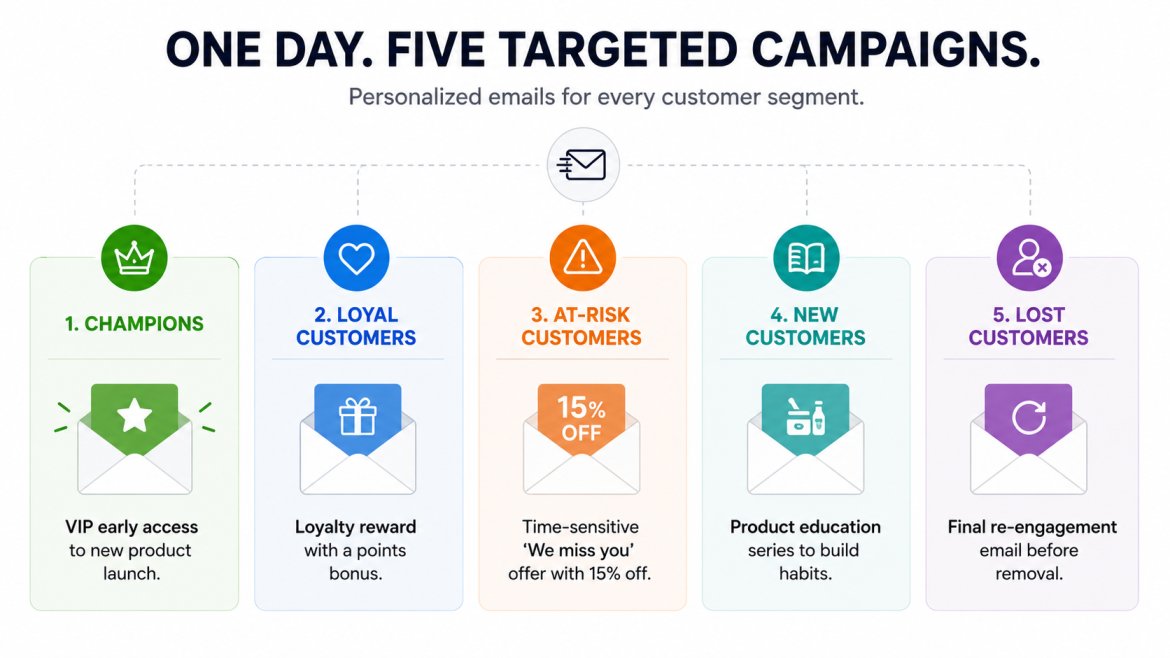
The same budget with five targeted messages. The result is higher open rates, higher conversion, and less email fatigue. This approach also works directly within the RFM analysis shopify stores. It uses built-in analytics apps or integrations with AI-powered platforms that automate segment detection.
Segmentation of Customers in RFM Analysis
The real power of RFM customer segmentation is in moving from scores to strategies. Here are the 11 standard segments used by marketing teams worldwide:
| Customer Segment | RFM Score | Business Value | Recommended Action |
| Champions | 5-5-5 | Highest | Reward, upsell, ask for reviews |
| Loyal Customers | 4-5-4 or 5-4-5 | Very High | Loyalty programs, early access deals |
| Potential Loyalists | 4-2-3 or 5-3-3 | High | Onboarding campaigns, bundle offers |
| New Customers | 5-1-1 | Moderate | Welcome series, first purchase follow-up |
| Promising | 4-1-1 | Moderate | Engagement offers, educational content |
| Need Attention | 3-3-3 | Moderate | Reactivation emails, limited-time deals |
| About to Sleep | 2-2-2 | Low-Moderate | Win-back campaigns, discount incentives |
| At Risk | 2-4-4 | High (at risk) | Urgent win-back, personal outreach |
| Cannot Lose Them | 1-5-5 | Critical | Personalized outreach, VIP retention |
| Hibernating | 1-1-2 | Low | Low-cost reactivation, survey feedback |
| Lost Customers | 1-1-1 | Minimal | Sunset or minimal-cost re-engagement |
Not every customer requires the same level of effort. A good RFM segmentation tells you exactly where to spend your energy.
How RFM Analysis Powers Ecommerce Marketing
Ecommerce brands operate with thin margins and high competition. Every marketing dollar has to work harder. That is why RFM analysis ecommerce teams have made this model central to the growth strategies.
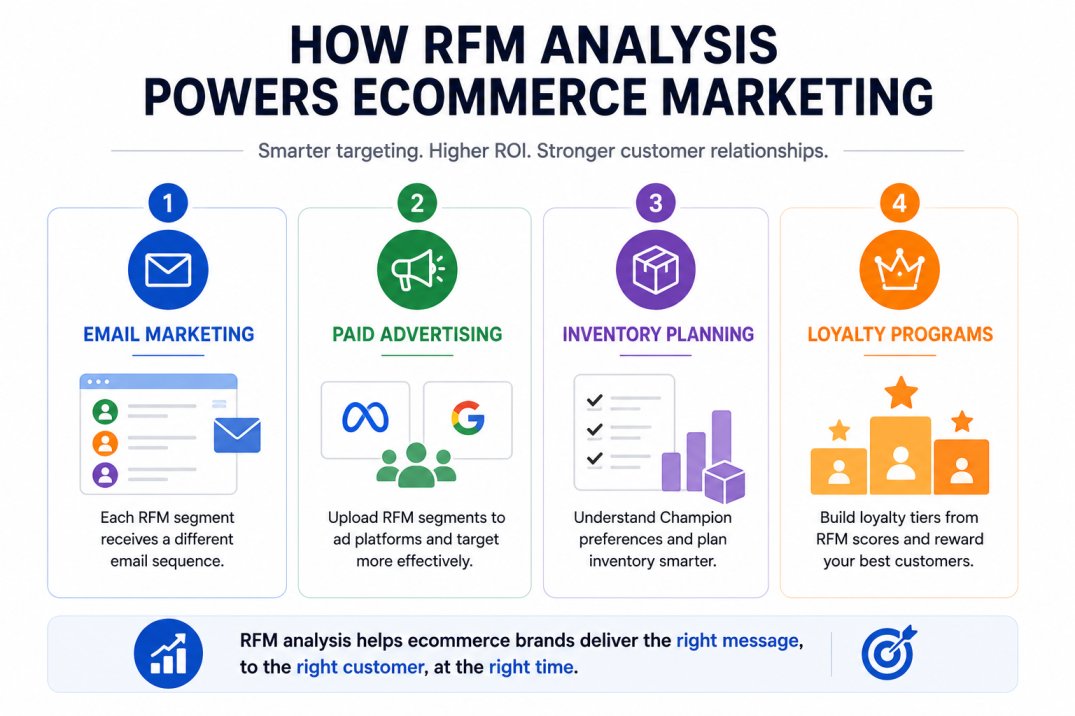
Here is how modern ecommerce brands apply RFM in practice:
-
Email Marketing
Each RFM segment receives a different email sequence. Champions get VIP content. At-risk customers get urgency-based win-back campaigns. New customers get onboarding flows.
-
Paid Advertising
RFM segments can be uploaded to Facebook Ads or Google Ads as custom audiences. You bid higher for Champion lookalikes and lower for segments that rarely convert.
-
Inventory Planning
When you know which customers are Champions, you know which products they favor. That drives smarter inventory decisions.
-
Loyalty Programs
Loyalty tiers can be built directly from RFM scores, automatically rewarding your most frequent and highest-value customers.
For teams that want to go beyond basic reporting, self-service data analytics tools let marketers explore RFM data without waiting for a data analyst.
Tools Needed to Run RFM Analysis
The right tool depends on your data volume, team capability, and how frequently you need to refresh your segments.
-
Microsoft Excel or Google Sheets
Best for small businesses or one-time analyses. You can build an RFM model manually using PERCENTRANK formulas and pivot tables. It takes time, but it works for datasets with fewer than 10,000 customers. Limitations: no real-time updates, no automation, error-prone at scale.
-
Python (Pandas Library)
Best for data analysts and technical teams. Python lets you automate RFM scoring with just 20-30 lines of code using the pandas library. You can schedule it to run weekly and output the results to a CSV file or a database. Great for scale, but requires coding knowledge.
-
Shopify Analytics and Apps
For RFM analysis of Shopify stores, several native and third-party apps automatically compute RFM scores. Tools like Reveal, Lifetimely, and Triple Whale offer segment views directly inside the Shopify dashboard.
-
AI-Powered Analytics Platforms
The most scalable option. AI platforms ingest your transaction data, score customers in real time, and automatically surface actionable segments. They eliminate manual work entirely and keep your RFM scores up to date as customer behavior changes.
How to Do RFM Analysis in 5 Steps: Simple Calculation Method
If you have a spreadsheet with your customer purchase history, you have everything you need. Here is a clear, step-by-step breakdown of how RFM analysis works from scratch.
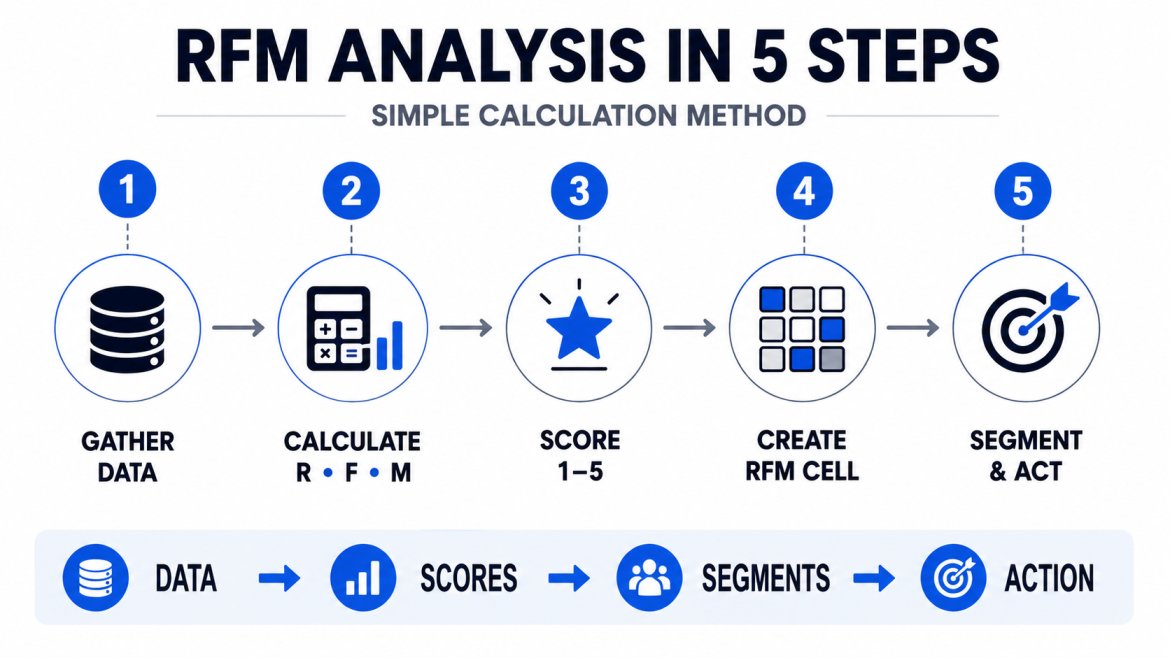
Step 1: Gather Your Customer Transaction Data
Start by exporting your purchase data for the last 12 months. You only need three pieces of information for each customer:
- Customer ID (a unique identifier for each buyer)
- Date of last purchase (to calculate Recency)
- Total number of orders (for Frequency)
- Total amount spent (for Monetary value)
Most ecommerce platforms, such as Shopify, WooCommerce, and Magento, let you export this as a simple CSV file. If you use a CRM, pull the same data from there. The cleaner your data, the more accurate your RFM scores will be.
Step 2: Calculate R, F, and M for Every Customer
Now calculate the three raw values for each customer:
- Recency: Count the number of days between today and their last purchase date. A customer who bought 10 days ago has a Recency of 10. A customer who bought 200 days ago has a Recency of 200.
- Frequency: Count the total number of orders they placed in the past 12 months. Simple order count per customer.
- Monetary: Add up the total revenue they generated in the same 12-month period.
At this point, you have a raw number for R, F, and M for every customer. The next step turns those numbers into scores.
Step 3: Score Each Customer from 1 to 5
Divide your customers into five equal groups for each dimension. This method is called quintile scoring. The top 20% of customers on each dimension score a 5. The bottom 20% score a 1.
- Recency scoring: The fewer days since purchase, the higher the score. Customers who bought in the last 30 days score 5. Customers who last bought over 180 days ago score 1.
- Frequency scoring: More orders equal a higher score. Customers with 10 or more orders score 5. Customers with only 1 order score 1.
- Monetary scoring: Higher total spend equals a higher score. Customers who spent over $500 score 5. Customers who spent under $50 score 1.
Use the reference table below to guide your scoring thresholds:
RFM Score Reference Table
| Score | Recency (Days Since Purchase) | Frequency (Orders in 6 Months) | Monetary (Total Spend) |
| 5 (Best) | 0-30 days | 10+ orders | $500+ |
| 4 | 31-60 days | 7-9 orders | $300-$499 |
| 3 | 61-90 days | 4-6 orders | $150-$299 |
| 2 | 91-180 days | 2-3 orders | $50-$149 |
| 1 (Lowest) | 181+ days | 1 order | Under $50 |
Step 4: Combine the Three Scores into One RFM Cell
Once every customer has a score from 1 to 5 for Recency, Frequency, and Monetary, combine them into a single RFM cell. Write them in R-F-M order.
The RFM cell is your customer’s fingerprint. No two segments behave the same way, and no two segments need the same marketing strategy.
Step 5: Group Customers into Segments and Take Action
The final step is to map each RFM cell to a named segment. Customers scoring 5-5-5 are your Champions. Customers scoring 1-1-1 are your Lost customers. Every score in between maps to one of the 11 standard RFM segments.
Once you have your segments, the analysis is done. Now it is time to act. A pre-built ecommerce analytics dashboard can automatically display these RFM segments. It updates in real time as customer behavior changes, so your team always works from fresh data.
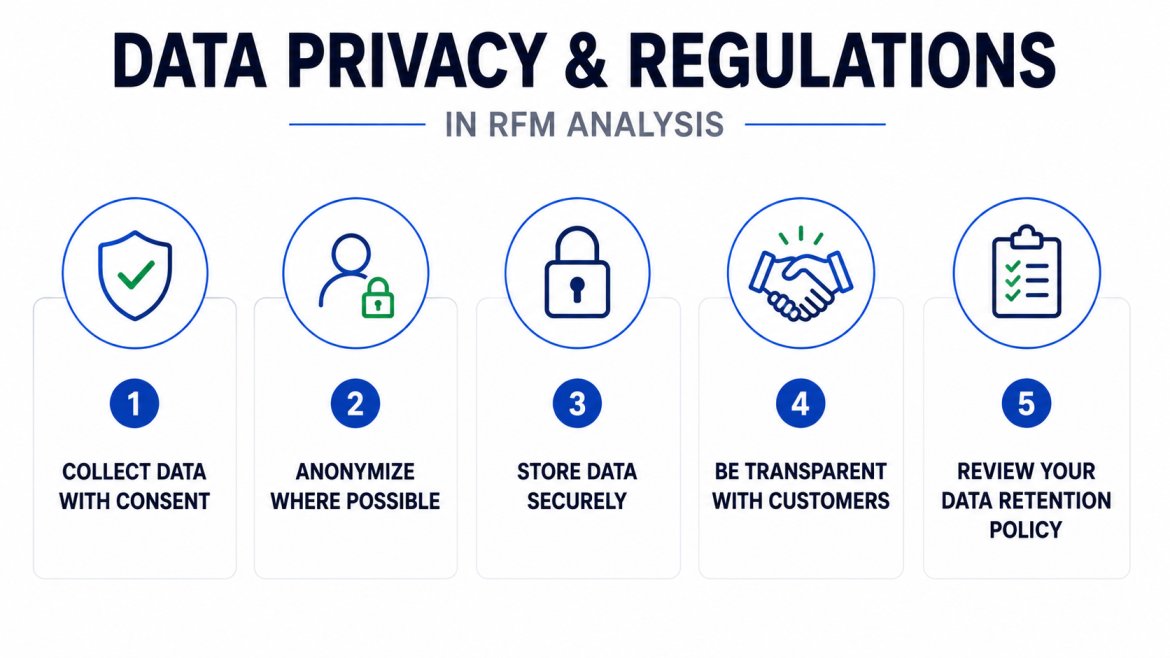
Data Privacy and Regulations in RFM Analysis
RFM analysis runs on customer transaction data. That data is powerful. But it also comes with responsibilities. Before you score a single customer, you need to understand the basic rules around data privacy.
Here are a few important rules to follow:
-
Collect data with consent
Under regulations such as the GDPR in Europe and the CCPA in California, you must have a legal basis for storing and using customer purchase data.
-
Anonymize where possible
If you are running RFM analysis for reporting or testing, use anonymized customer IDs instead of names or email addresses to reduce risk.
-
Store data securely
Customer transaction data should be stored in encrypted, access-controlled databases. Limit who on your team can view raw customer records.
-
Be transparent with customers
Your privacy policy should clearly state that you use purchase history to personalize marketing. Most customers are comfortable with this when it is disclosed.
-
Review your data retention policy
Do not hold onto customer data indefinitely. Most RFM models use a 12-month rolling window. Delete or anonymize older records that are no longer needed for analysis.
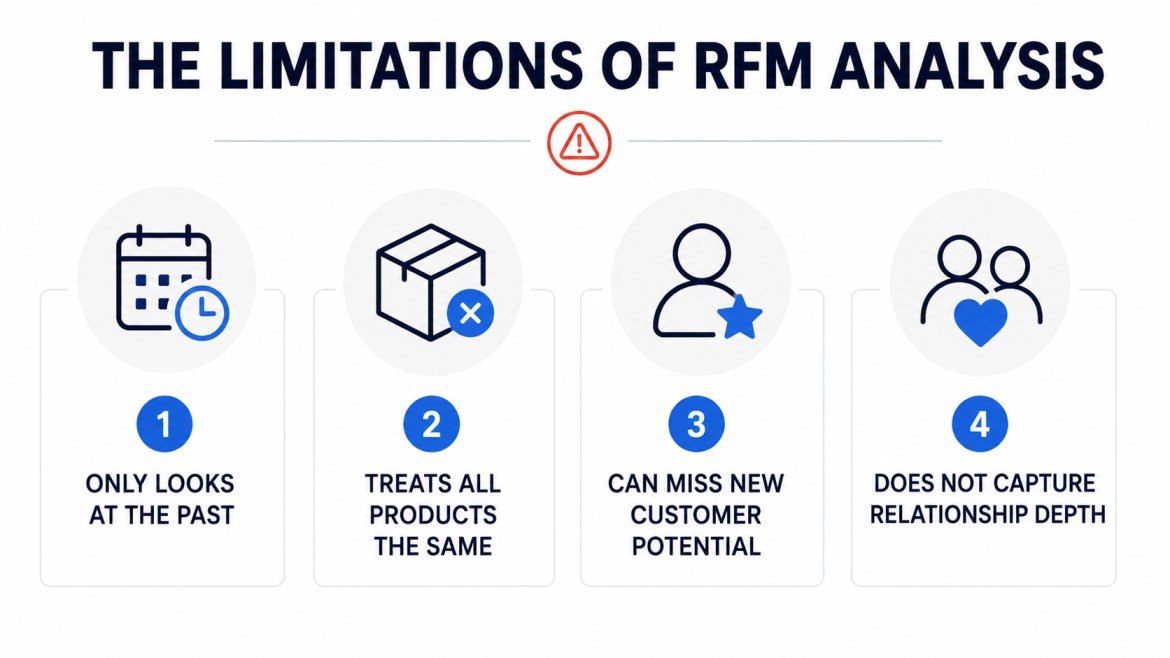
The Limitations of RFM Analysis
RFM analysis is a powerful tool. But it has some challenges. Understanding its limitations helps you use it more effectively and avoid common mistakes.
-
Only Looks at the Past
RFM analysis is entirely backward-looking. It tells you what a customer did. It does not tell you what they will do next. A customer who bought three times last year may have moved, changed income level, or found a better alternative.
RFM score does not capture any of that. To predict future behavior, you need to combine RFM with a predictive model or CLV calculation.
-
Treats All Products the Same
RFM analysis measures how much a customer has spent in total. It does not distinguish between a high-margin product and a low-margin one.
A customer who spent $500 on your most profitable item is very different from one who spent $500 on a heavily discounted bundle.
-
Can Miss New Customer Potential
New customers almost always score low on RFM analysis. They have low Frequency and low Monetary value by definition. This means RFM can undervalue a brand-new customer who has high future potential.
Pairing RFM with first-purchase behavior analysis helps solve this gap.
-
Does Not Capture Relationship Depth
A customer who engages with your brand on social media, refers friends, and leaves reviews may score low on RFM if they buy infrequently. RFM does not measure brand advocacy or emotional loyalty.
For a complete picture, combine RFM with engagement metrics like email open rates, NPS scores, and referral activity.
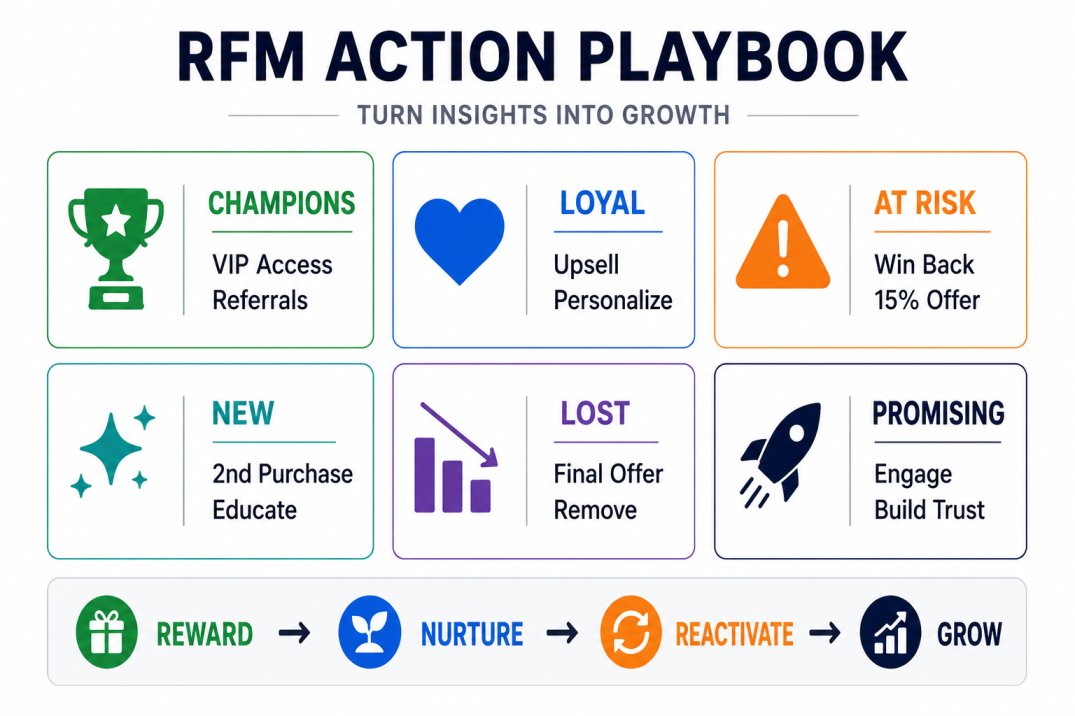
Actionable Strategies After RFM Analysis
Running your RFM analysis is only the first step. The real value comes from what you do with the results. Here are clear, practical strategies for each major segment.
-
Champion Customers: Reward and Leverage Them
Your Champions are your most valuable customers.
- Give them early access to new products.
- Create a VIP tier specifically for them.
- Ask them to leave reviews or refer friends.
Champions who feel recognized become long-term brand advocates.
-
Loyal Customers: Deepen the Relationship
Loyal Customers buy regularly but may not spend as much as Champions. The goal here is to increase their average order value.
- Offer product bundles, subscription upgrades, or loyalty points that incentivize larger purchases.
- Personalize your communications based on their purchase history.
- If they always buy skincare, do not send them homeware promotions.
Relevance is what turns Loyal Customers into Champions.
-
At Risk Customers: Act Fast
At-risk customers used to be good buyers but have gone quiet.
- Send a time-sensitive win-back email within 48 hours of identifying them in your RFM analysis.
- Use urgency. A subject line like ‘We noticed you have not visited in a while’ paired with a 15% discount
- If email does not work, try SMS or retargeting ads.
Deadline works significantly better than a generic newsletter.
-
New Customers: Build the Habit Early
New customers score high on Recency but low on Frequency and Monetary value. The most important thing you can do is get them to make a second purchase.
- Send a post-purchase follow-up within 3 days.
- Recommend complementary products.
- Share how-to content that helps them get more value from what they bought.
Make the second purchase as easy as possible.
-
Lost Customers: Know When to Let Go
Lost customers scored low on all three dimensions. They have not bought in a long time, they rarely buy, and they spend very little.
- A small re-engagement campaign is worth trying.
- Send one final email with a generous offer. If they do not respond, remove them from your active marketing list.
Keeping unengaged contacts hurts your email deliverability and inflates your marketing costs.
-
Promising Customers: Bridge the Gap
These mid-tier segments represent your biggest growth opportunity. They have shown interest but have not fully committed.
- Focus on education and engagement.
- Share case studies, tutorials, and social proof that builds confidence in your brand.
- Offer a small incentive for their next purchase.
These customers are one good experience away from moving into your Loyal Customer tier.
Conclusion
RFM analysis is one of the most powerful and accessible frameworks in marketing analytics. It does not require a data science team. It does not require expensive software. It requires your transaction data, a clear scoring method, and the discipline to act on what you find.
The businesses that win are not the ones who collect the most data. They are the ones who use their data to treat each customer as an individual. RFM gives you the map. The segments show you where to go. The campaigns you build from there are what drive real revenue growth.
Start with your Champions. Protect your Loyalists. Win back your At Risk customers. And let go of the ones who are truly gone. That is not just a good marketing strategy. That is the foundation of a sustainable, customer-first business.
How ProactiveAI Makes RFM Analysis Easy for Every Business
Most businesses know they should segment their customers. But pulling the data, building the scores, and refreshing the segments every month? That takes time, most teams simply do not have.
ProactiveAI does this for you automatically. It connects to your sales data, scores every customer on Recency, Frequency, and Monetary value, and shows you your segments in one clean dashboard.
No spreadsheets. No coding. No waiting on a data analyst. Just type a simple question like “Who are my best customers this month?” and ProactiveAI gives you the answer instantly.
Your Champions get rewarded faster. Your at-risk customers get saved sooner. And your marketing budget goes exactly where it should.
Frequently Asked Questions
What is RFM analysis?
RFM analysis is a customer segmentation method that evaluates Recency, Frequency, and Monetary value to identify customer behavior and prioritize marketing efforts.
How do you calculate an RFM score?
Assign scores to the Recency, Frequency, and Monetary metrics, then combine them into a three-digit score that represents each customer’s overall value.
How is RFM used to identify high-value customers?
Customers with recent purchases, frequent transactions, and high spending receive higher RFM scores, helping businesses identify their most valuable customers.
What is the difference between RFM and CLV?
RFM analyzes past customer behavior, while Customer Lifetime Value (CLV) estimates the total future revenue a customer is expected to generate.
You might also like
Handpicked articles for your reading list.
Get the latest insights on Conversational AI
Stay ahead of the curve with weekly updates on data analytics, AI trends, and eCommerce growth strategies delivered straight to your inbox.
Join 5,000+ industry leaders. Zero spam, just pure insights.