
 SparxIT
 SPXCommerce
 What's Your A



eCommerce
AI & Analytics
eCommerce Email Marketing Analytics: Metrics That Actually Predict Revenue
-
Vikash Sharma
- Jul 06, 2026
- 9 mins read
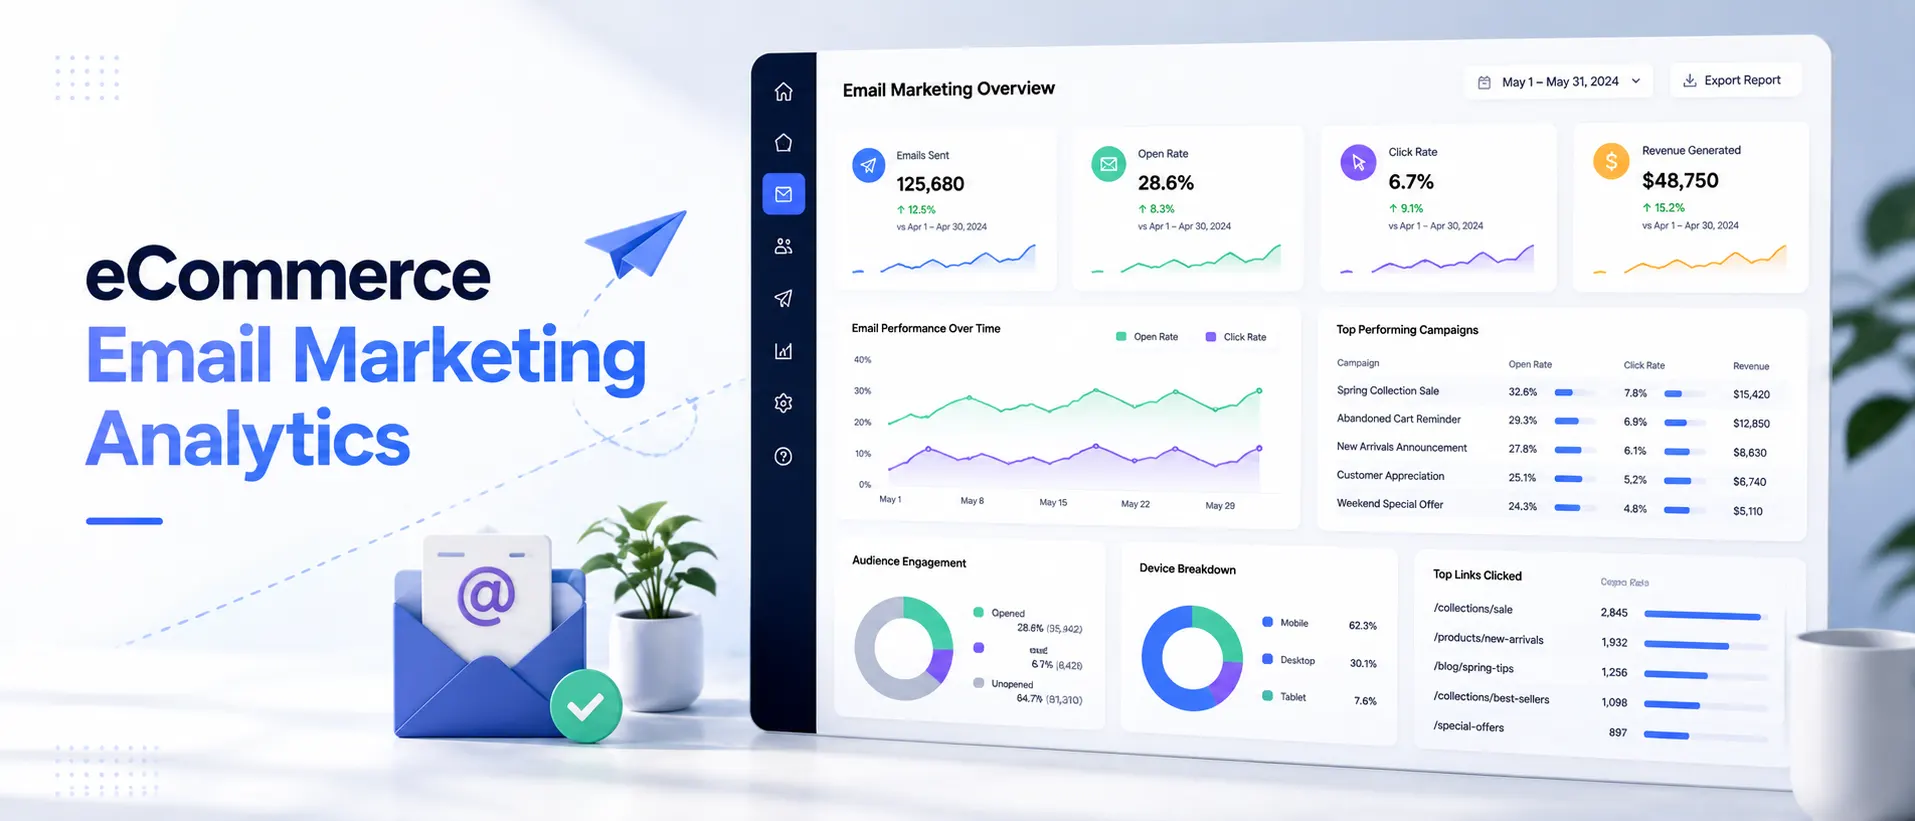
You have configured your email flows, launched campaigns on schedule, and achieved strong open rates. However, when your CEO asks, “How much business did email really bring you this quarter?” you pause. The reluctance to pay costs you more.
There is an overwhelming amount of email data across most eCommerce brands, but very few have the energy to seek out email insights. They monitor opens and clicks, but are unable to tie them back to real dollars. Many brands celebrate a 40% open rate even when it generates no measurable revenue. When something breaks, a flow underperforms, or a segment goes cold, they find out weeks later.
This is all different when done right with ecommerce email marketing analytics. Email becomes the most predictable revenue engine when you focus on metrics that truly indicate buyer intent, attribute revenue to the right touchpoints, and proactively track list health.
This guide explains why each of these email KPIs is important, what they mean, and how you can leverage them, using tools such as ProactiveAI, to help teams turn email data into revenue-driven decisions.
What is eCommerce Email Marketing Analytics?
eCommerce email marketing analytics involves analyzing, understanding, and optimizing your email campaigns to gauge their impact on revenue, customer actions, and business growth.
It goes beyond basic reporting by connecting email engagement with business outcomes. Effective email analytics is linking subscriber actions (open, click, buy, refunds) to downstream business outcomes, such as:
- What percentage of your first-time customers are making purchases as a result of your e-mail campaigns?
- How much do I make per subscriber?
- Which segments are wasting time and money before they churn?
- Are my campaigns being run interfering with my automated flows?
Email reporting explains what happened, whereas email analytics reveals why it happened and what actions to take next. Email analytics will let you know what went right and what to do next.
Why Vanity Metrics Will Mislead You?
Many organizations rely excessively on vanity metrics when evaluating email performance. Your open rates, unsubscribe rates, and even your click rates might seem strong, but your email channel is bleeding revenue.
For instance, a fashion company finds that the “Best Customers” segment has not purchased anything from them in the last three months. The offers were relevant, but customers were not converting. Why? Their flows weren’t customized based on purchase history, so those who had subscribed before were getting the same ones as new customers.
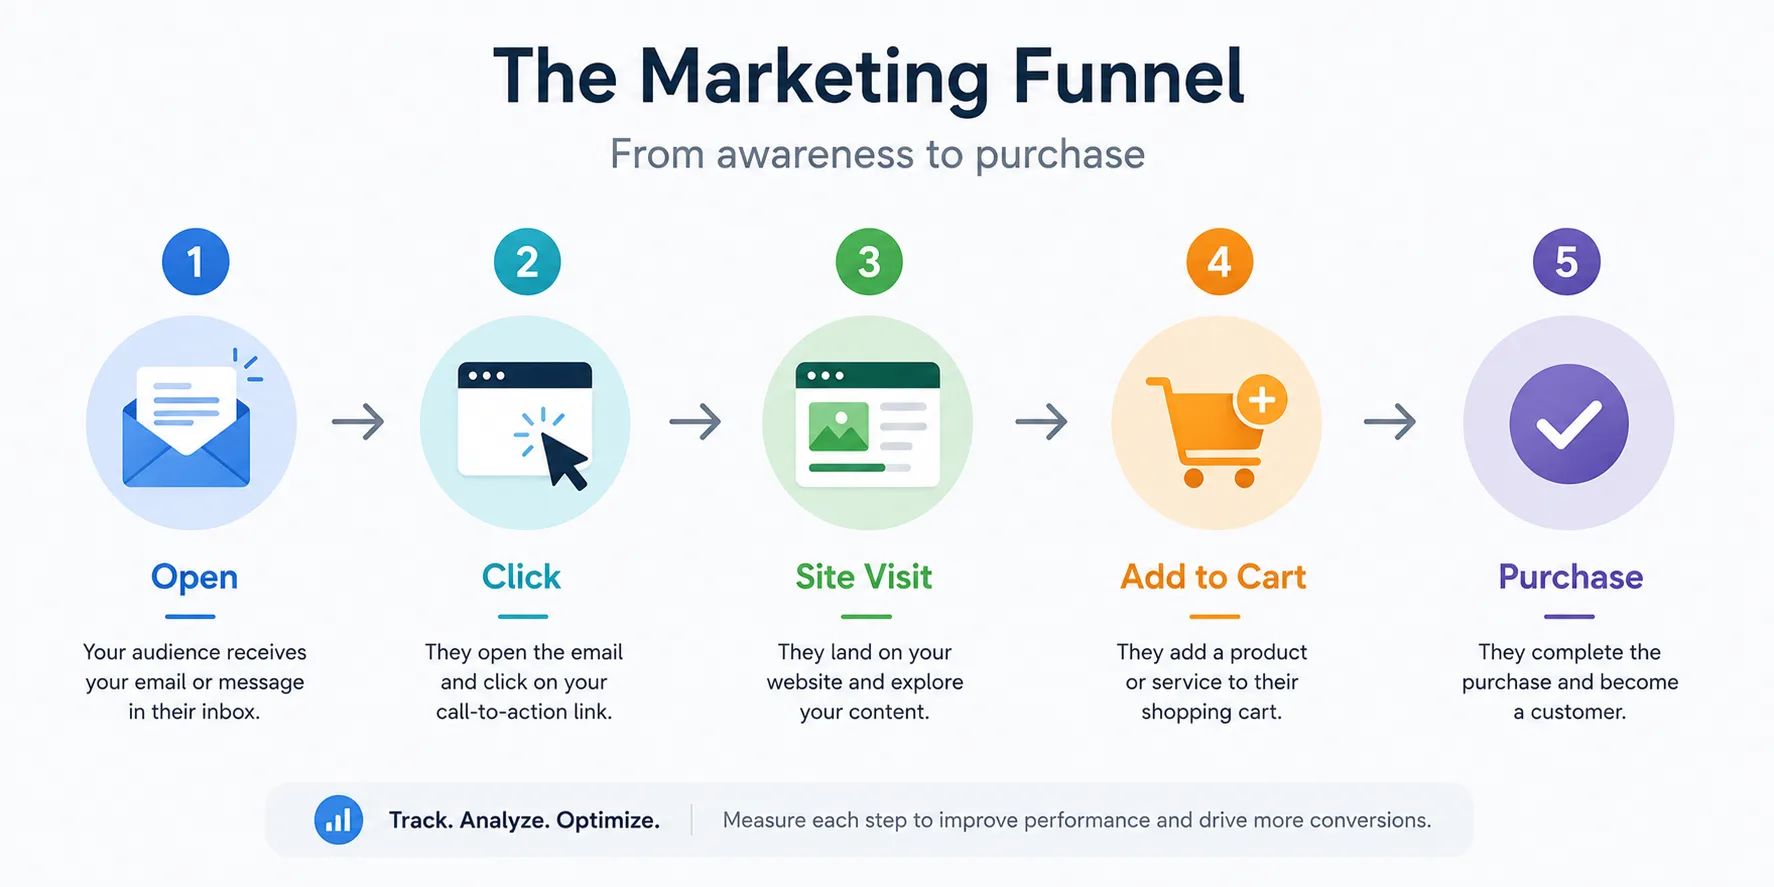
The list of “feel-good” metrics doesn’t match the list of revenue-prediction metrics. The question of email open rate versus click rate is worth discussing, but neither is an indicator of bottom-line performance on its own. The important thing is the entire funnel: Open → click → site visit → add to cart → purchase.
The Core Email Marketing Metrics for eCommerce Revenue
These are the ecommerce email KPIs that actually relate to revenue performance:
Revenue Per Email (RPE)
The most critical measure. Divide the total money earned from the email by the number of emails sent out.
RPE = Total Email Revenue / Emails Sent
The benchmark is $0.08–$0.15 RPE, which is typical for eCommerce. Campaigns that exceed $0.20 (and flows such as abandoned cart that exceed $0.50) are performing well.
Click-to-Conversion Rate (CTCR)
This metric measures the percentage of people who clicked and converted into buyers. It connects the dots between email engagement and web activity.
The formula for calculating the CTCR is:
CTCR = (Purchases / Unique Clicks) X 100
This metric helps distinguish high-performing campaigns from those that require optimization. An email with a 5% click rate and a 1% CTCR is not performing as well as one with a 2% click rate and a 6% CTCR.
Revenue Per Subscriber (RPS)
Calculates your list’s long-term value based on the number of subscribers.
The formula to calculate RPS is:
RPS = Total 12-Month Email Revenue ÷ Active Subscribers
This serves as a key strategic metric for evaluating the long-term ROI of your eCommerce email marketing program. It’s a snapshot of the value of a new subscriber to your list.
Email Open Rate vs. Click Rate: The Right Framing
Open rate metrics track how many emails are opened and how well the subject line performs. Click rate is a metric that indicates content relevance and the effectiveness of CTAs. These factors are neither sufficient nor necessary to forecast revenue. As team players, they help you discover where your funnel is going wrong:
| Metric Combination | What It Signals |
| High open and low click | Subject lines are effective, but the content or CTA needs improvement. |
| Low open, high click (among clickers) | Possible deliverability issues; engaged audience performs well once reached. |
| High open, low CTCR | A landing page or offer mismatch is likely reducing conversions. |
| All three high | Strong, healthy, revenue-generating email performance. |
Email Flow Performance Metrics: What to Watch
Automated flows such as welcome series, abandoned cart, post-purchase, and win-back campaigns typically contribute 30% to 50% of total email revenue. However, most brands audit them only once every three months or less.
Send email performance data through to monitor in real time:
Abandoned Cart Flow
- Abandoned carts recovered: the percentage of those who abandoned their carts that are recovered by the flow.
- Performance of Email 1 vs. Email 2 vs. Email 3: If Email 2 does not outperform Email 1, test alternative messaging, incentives, or timing strategies!
- Average order value (AOV) recovery: If the AOV is high, then it is worth the discount, and if it is low, then perhaps you are discounting when it is not worth it.
Welcome Series
- Conversion rate by email position: Does Email 3 outperform Email 1? That may mean your onboarding sequence delays the offer too long
- Revenue attributed within 30 days: How well is your welcome series preparing for your first purchase
Win-Back Flow
- Reactivation rate: Percentage of churned users that re-engage and make a purchase.
- Time to reactivation: Shorter reactivation window = stronger brand loyalty signals in your list
Post-Purchase Flow
- Repeat purchase rate from flow: Rate of return for post-purchase emails
- Days to second purchase: Use to fine-tune send times in your sequence
Email List Health Metrics: The Foundation Everything Else Rests On
The key isn’t so much the size of your email list as its health. Many brands overlook email list health until deliverability issues begin affecting inbox placement.
| Key Health Indicators | Metric | Healthy Benchmark | Warning Zone |
| List growth rate (monthly) | List growth rate | 3–5%+ | <1% or negative |
| Hard bounce rate | Hard bounce rate | <0.5% | >1% |
| Spam complaint rate | Spam complaint rate | <0.08% | >0.1% |
| 90-day active rate | 90-day active rate | 25–40%+ | <15% |
| Unsubscribe rate (per send) | Unsubscribe rate (per send) | <0.3% | >0.5% |
Email Segmentation Analytics: Why Health Varies by Segment
The list of health challenges varies significantly across customer segments. New subscribers’ actions differ from those of their 12-month loyalists. Customers who bought last week react to the product differently from those who haven’t opened it for 6 months.
With email segmentation analytics, you can see health metrics for each segment, rather than a “25% active rate” that obscures a segment on the verge of collapse. And you can see which segments are harming your deliverability, suppress them, and re-engage them before it becomes a domain-level issue.
Email Revenue Attribution: Campaigns vs. Flows
Email revenue attribution is one of the most discussed yet least understood topics in email marketing. This can distort revenue reporting and lead organizations to overinvest in email while underinvesting in channels that influenced the purchase decision.
The Attribution Problem
A 5-day last-click attribution window is the default window for most ESPs (email service providers). Anyone who opens up a campaign email and purchases 4 days later (even if they found you first via a Google ad) counts as email revenue.
This skews email revenue numbers and may cause the channel to be over-invested in email and under-invested in the channel that actually drove the decision.
A Better Attribution Framework
Multi-touch attribution distributes credit to all touchpoints in a customer’s journey. For email specifically:
- Flow attribution: All credit automated emails that lead to a purchase within 1-3 days of a triggering event (such as a cart abandonment and then purchased within 48 hours)
- For broadcast campaigns: Use a shorter window (24–48 hours).
- Revenue overlap analysis: Determine which customers received a campaign and a flow email before they made a purchase, and how the credit should be divided.
The Klaviyo analytics ecommerce ecosystem and, for that matter, all attribution tools allow you to set these windows. Organizations should apply a consistent attribution methodology over time to enable accurate performance comparisons.
Campaigns vs. Flows: How Revenue Typically Breaks Down
| Email Type | Typical % of Total Email Revenue | Primary Metric |
| Automated Flows | 35–50% | Revenue per recipient |
| Promotional Campaigns | 40–55% | Revenue generated per email sent |
| Transactional Emails | 5–15% | Repeat purchase rate |
Your automation plan is under-optimized if your flows don’t account for more than 30% of your email revenue.
How to Calculate Email Marketing ROI for eCommerce?
Calculating email marketing ROI is straightforward, but it requires clean and accurately attributed data.
ROI Formula: % ROI = (Email Revenue – Email Program Cost) / Email Program Cost x 100
When adding up “Email Program Cost”, what should be included?
- $10/month (pro-rated) ESP subscription fee.
- The fees for copywriting and design.
- Cost of strategy and setup (estimate hourly rate x hours).
- All agency fees and/or freelance fees.
Sample Calculation
| Input | Value |
| Monthly email revenue | $42,000 |
| ESP cost | $800 |
| Copywriting + design | $2,000 |
| Strategy time (10 hrs × $75) | $750 |
| Total cost | $3,550 |
| Email ROI | 1,083% |
Email marketing consistently delivers among the highest ROI across digital channels when organizations implement accurate attribution and optimization practices. One ROI that’s 1,000x, based on inflated attribution numbers, is a false signal, while one based on conservatively attributed revenue from multi-touch is a real competitive advantage.
Tools That Make Email Analytics Actually Useful
Modern email analytics tools go beyond reporting by directly linking email performance to revenue and customer behavior. They help teams understand not just what changed, but why it changed and what actions to take next.
The best platforms combine conversational AI insights, pre-built dashboards, accurate attribution, and forecasting, while enabling self-service access across teams. This turns email analytics from a reporting function into a practical driver of growth and decision-making.
1. Klaviyo
The leading ESP for eCommerce. Here are some of the key analytics ecommerce features of Klaviyo: flow analytics, predictive CLV, revenue attribution dashboards, and segment-level performance breakdowns. Ideal for Shopify and WooCommerce brands with annual revenues greater than $500K.
2. Postscript + Klaviyo (Combined)
If brands are also using email marketing, the ability to view combined analytics enables cross-channel revenue attribution, which is essential for understanding whether SMS and email are competing for the same audience and/or working together.
3. Google Analytics 4 (GA4)
Essential to understand what happens post-click on email. Configure UTM parameters for email campaigns to track sessions, conversions, and revenue in GA4. This provides you with some platform-independent data for your email revenues that you can compare with your ESP’s.
4. Triple Whale / Northbeam
For brands running paid campaigns, these tools provide multi-touch attribution models that include email, giving brands a better understanding of how effective their email program is alongside other channels.
Why ProactiveAI Gives You an Edge in eCommere Email Marketing Analytics?
While most analytics platforms report performance data, ProactiveAI explains performance drivers and recommends actionable next steps. It also has conversation-based AI analytics that enable marketers to query it in natural language and get instant, data-driven answers without needing to use SQL or rely on analysts.
It even comes with a pre-built eCommerce analytics dashboard that features ready-to-use KPI views, including revenue per email (RPE), click-to-conversion rate (CTCR), list health scores, flow performance, and attribution reporting. This eliminates the need to develop complicated reporting systems from scratch.
In addition to reporting, ProactiveAI’s forecasting engine leverages email performance metrics to forecast revenue, so businesses can predict how list health, send frequency, and campaign optimization will influence revenue. A self-service approach to analytics allows marketers, merchandising teams, and executives to gain insights themselves and make quicker, more aligned decisions across the organization.
Conclusion
Email often becomes the highest-performing channel in eCommerce when organizations measure and optimize it correctly. Attaching no conversion to email opens and clicks leaves you flying blind.
The brands that will succeed with email this year and for years to come will do so by making email analytics their business strategy, rather than a tactical tool. They will measure the right metrics, attribute revenue fairly, proactively monitor list health, and leverage intelligent tools to surface insights before everyone else.
The objective is not to collect more data but to act on the right data at the right time. It is the right data at the right time, interpreted correctly, and acted on quickly.
However, if you’re looking to take your email reporting past the surface and start building a real ecommerce email marketing analytics practice, ProactiveAI is designed to do just that, with pre-built dashboards, AI-powered querying, and predictive revenue forecasting.
Frequently Asked Questions
What email marketing metrics matter most for eCommerce revenue?
Revenue Per Email (RPE), Click-to-Conversion Rate, Revenue Per Subscriber, and flow recovery rates (especially abandoned cart) are metrics that can most directly predict revenue. Open rates and click rates are great for identifying funnel leaks, but not a standalone measure of revenue performance.
How do you attribute revenue to email campaigns vs. flows?
For each use, separate attribution windows: 24-48 hours for broadcast campaigns and 1-3 days for triggered flows. To be more precise, use multi-touch attribution to allocate revenue to customers who received both a campaign and a flow, allocating revenue proportionally to the touchpoints each customer actually interacted with, rather than giving revenue to the last touchpoint with the email.
What is a good email click-to-conversion rate for an eCommerce brand?
Campaigns generally have a click-to-conversion rate of 3–8%, and high-intent flows, such as abandoned cart recovery, have a C2C rate of 8–20%. When the CTCR is below 2%, the problem is most likely not with the email but with landing page relevance or offer mismatch.
How do you measure the ROI of email marketing for an online store?
To calculate ROI, you simply subtract the overall email program costs from the attributed email revenue and divide by the program costs. When you apply attribution conservatively and the program’s costs are fully accounted for, email is likely to generate 800–1,200%+ ROI. To validate ESP revenue figures, cross-reference with GA4.
How often should you audit the health of your eCommerce email list?
Perform a light audit once a month and monitor bounce rates, spam complaints, and the percentage of active subscribers by segment. Perform a complete list health check quarterly, including disengaged list suppression, churning list segments, and testing whether re-engagement is working as expected, to prevent list decay from affecting deliverability.
You might also like
Handpicked articles for your reading list.

Get the latest insights on Conversational AI
Stay ahead of the curve with weekly updates on data analytics, AI trends, and eCommerce growth strategies delivered straight to your inbox.
Join 5,000+ industry leaders. Zero spam, just pure insights.