
 SparxIT
 SPXCommerce
 What's Your A

eCommerce
eCommerce
eCommerce Channel Analytics: How to Measure Performance Across Meta, Google, TikTok, and Email
-
Diksha Singh
- Jul 07, 2026
- 9 mins read
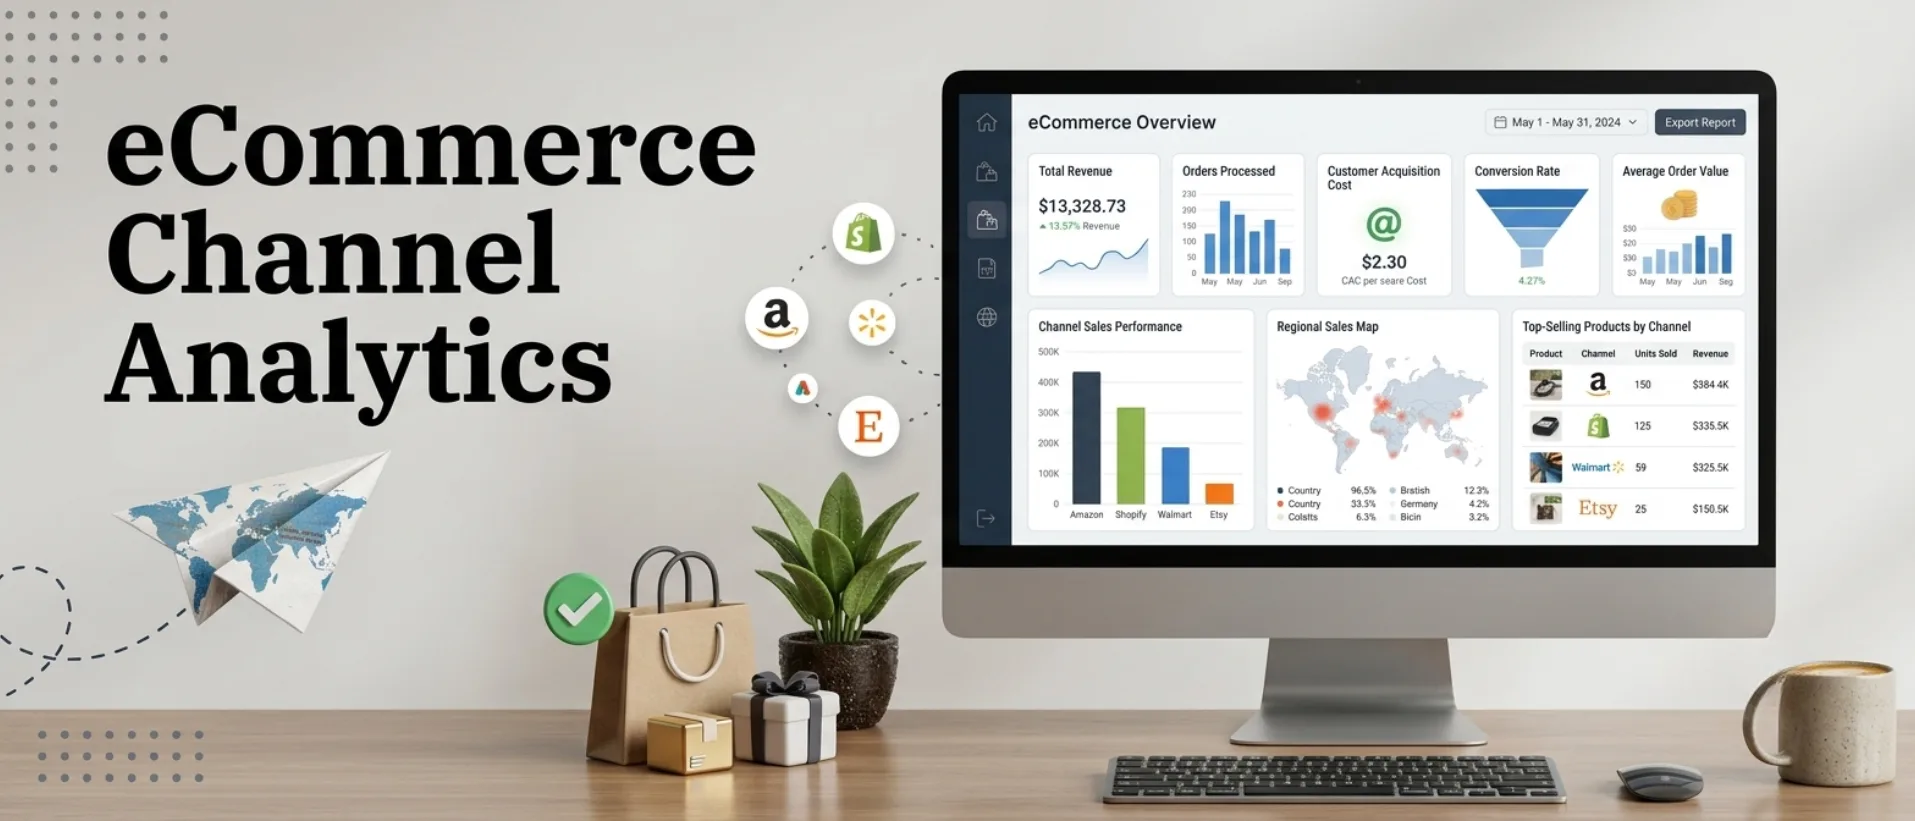
You are running campaigns across Meta, Google, and TikTok. Your email subscriber list continues to grow and drive conversions. You’re reaping the revenue rewards, but you’re not really able to say which channels drive the strongest results. Your Meta dashboard states one thing. Google Analytics states otherwise. Your email system takes 50% of your orders. TikTok often reports ROAS figures that appear too good to be true.
This is the hidden challenge that most DTC brands face: data overload with no clarity. More reporting, less confidence in decisions. Budget money is misspent, top-performing channels are starved, and underperforming channels continue to bleed budget. As a result, no one can seem to agree on what the numbers actually mean.
The solution is disciplined ecommerce channel analytics, an approach to measuring, comparing, and consolidating performance across all channels you run. If executed properly, it can make all the difference in delivering a single source of truth from many reports, leading to smarter budget decisions, better creative strategy, and increased revenue growth.
What is eCommerce Channel Analytics?
eCommerce channel analytics is the process of monitoring, measuring, and analyzing the performance of marketing channels such as paid social, paid search, organic, email, SMS, and other channels.
It uses data related to revenue, customer acquisition, and long-term customer value to evaluate channel effectiveness and support business growth. It’s not just about vanity metrics such as views or clicks. True channel analytics link the top of the funnel to the bottom of the funnel, purchases, repeat orders, customer lifetime value (LTV), and profitability.
Think of channel analytics as a business performance framework that evaluates both outcomes and efficiency. If you don’t know the shooting percentage, the plus-minus, and turnover totals of a player, then it doesn’t mean anything when he scores 20 points. In the same way, if you know that a channel has generated revenue, you need to know what it costs to do so, who the consumers are, and what the profit margin is.
Why Does Multi-Channel Measurement Break Down?
Although multi-channel ecommerce analytics appears straightforward, implementation often becomes highly complex. Here’s why:
Each platform has its own attribution model
A 7-day click / 1-day view window is the default window for Meta. Google Ads uses the default data-driven attribution. The most likely answer is that your email platform uses last-click attribution. As a result, multiple platforms often claim credit for the same order.
Tracking gaps are everywhere
Apple’s privacy changes on iOS have removed the foundation of pixel-based tracking. Without server-side event matching, up to 30–40% of conversions can go untracked on Meta.
Data lives in silos
Your campaign data resides in Ads Manager. Google data is in GA4 and Google Ads. Email data is in Klaviyo. These are typically gathered by hand (often in a spreadsheet), which is tedious, complex, and soon out of date.
Revenue by channel ecommerce
Reporting becomes a political exercise rather than a strategic one, with each channel “winning” in its own dashboard.
Breaking Down Each Channel: What to Measure and Why
Not all marketing channels contribute to growth in the same way. Meta is great for generating demand, Google is great for gathering existing intent, TikTok is great for finding new intent, and email is great for conversion and customer retention. However, if the true measure of performance is assessed by metrics that reflect each channel’s specific contribution to the customer journey, it provides a more accurate picture. This is more reliable than relying on platform-reported ROAS.
Meta (Facebook & Instagram)
Despite being one of the most impactful channels for DTC brands, Meta is one of the most misunderstood. Key metric to monitor:
- Cost Per Acquisition (CPA): not just ROAS
- Blended CPM: A rising CPM signals audience saturation
- New Customer Revenue %: Are you acquiring new customers or primarily selling to existing ones?
- View-through conversions vs. click-through: Essential for understanding upper-funnel impact.
Close the tracking gap with the help of Meta’s Conversions API (CAPI) and pixel data. Your Meta and Google performance comparison will remain incomplete without server-side tracking data.
Google (Search, Shopping, Performance Max)
Google excels at capturing existing purchase intent, but attribution models may over-credit conversions initially influenced by Meta or TikTok campaigns.
Track:
- Monitor Search Impression Share across branded and category-specific keywords.
- Shopping ROAS by product category (not blended account ROAS)
- The brand vs. non-brand split is misleading, as brand campaigns artificially inflate ROAS.
- Performance Max asset groups often function as a black box and require continuous monitoring.
TikTok Shop Analytics for eCommerce
TikTok is no longer a brand-awareness game but a real commerce platform. Here are some of the metrics ecommerce brands should monitor on TikTok Shop:
- The V2P rate shows how effectively video content converts to sales, whether organic or paid, and is measured by video views.
- The creator affiliate performance when partners are not only creating real revenue but also views.
- There are several friction signals on TikTok Shop, and checkout abandonment rate is one of them.
- Monitor new customer acquisition costs on TikTok to evaluate campaign efficiency.
Email can be the highest-ROI channel on a per-channel basis, but it’s also the most misunderstood. It often “borrows” the credit of the paid channel that generated the initial purchase intent.
Track:
- The most accurate gauge of list health is revenue per recipient (RPR).
- Analyze campaign versus automated flow revenue to assess customer engagement and relationship quality.
- LTV by email acquisition source (Meta lead gen or organic sign-up)?
- Track subscriber growth and unsubscribe rates to forecast future email revenue potential.
A Practical Framework for Channel Performance Comparison
Do not consider the ROAS of single channels. Create a channel ROI comparison that is based on contribution margin or new customer acquisition cost (nCAC).
| Channel | Best Metric | Strength | Weakness |
| Meta | nCAC, Blended ROAS | Audience targeting, scalability | Attribution loss after iOS privacy changes |
| Google Search | CPA, Impression Share | High purchase intent, measurable performance | Limited top-of-funnel reach |
| TikTok | CPM, VTP Rate | Strong discovery, appeals to younger audiences | Attribution models are still maturing |
| RPR, LTV | Owned audience, low cost, easy to deploy | Often receives inflated last-click attribution credit |
Using post-purchase surveys (which ask customers, “Where did you hear about us?”) and Marketing Mix Modeling (MMM) in addition to platform-reported metrics, a clean channel performance comparison ecommerce framework can normalize these metrics.
How to Unify Cross-Channel Reporting
Cross-channel ecommerce reporting is all about having one place to see every channel’s performance, compare them, and act on them without switching between five different platforms.
This is usually done in three levels of architecture:
Layer 1: Data Collection
Import raw data from Meta Ads, Google Ads, TikTok Ads, Klaviyo, and your ecommerce platform (Shopify, WooCommerce, etc.). Use server-side tracking to fill pixel gaps.
Layer 2: Data Normalization
Consider uniform measurement of metrics in all channels. Meta and Google have different definitions of “conversion”. Revenue needs to be deduplicated. Customer IDs must be standardized in their interactions.
Layer 3: Reporting & Analysis
Your eCommerce analytics dashboard should surface channel-level insights side by side while allowing users to filter data by time period, product category, campaign type, and customer segment.
That’s where tools such as ProactiveAI can truly make a difference. Instead of building and maintaining this pipeline yourself, ProactiveAI’s data unification, normalization, and visualization features provide your team with a real-time, accurate representation of performance across all channels from the get-go.
Preventing Double-Counting Revenue Across Channels
The most prevalent and consequential mistake DTC brands make in doing channel mix analytics is double-counting. If your email, Google, and Meta each record the same $200 order, that’s $600 “attributed” revenue. Decisions are made on imaginary numbers.
How to fix it:
- Total revenue should be sourced from shopify or your backend. The revenue reported by the platform is not necessarily an indicator of its actual income.
- Use a single attribution model across channels. Choose one type of click and apply it to all examples for comparison.
- Add incrementality testing to your more expensive channels. Test holdouts on Meta and Google to learn about actual revenue lift, not attributed revenue.
- Post-purchase surveys are neglected. Directly asking customers where they discovered your brand remains one of the most reliable methods for validating attribution data.
The cleanest setup is platform data + backend order data + survey data, all of which are blended into a unified attribution model, and that’s why tools like ProactiveAI exist!
Tools That Make Channel Analytics Work
With the right channel analytics tools, businesses can consolidate all their data, monitor performance across marketing channels, measure attribution, and gain valuable insights to optimize and grow more effectively.
| Tool | Primary Function | Key Features | Best For |
| ProactiveAI | AI-supported eCommerce analytics and attribution | Seamless integration with Meta, Google, TikTok, Klaviyo, and Shopify
Automated data ingestion AI-driven anomaly detection Conversational AI analytics (natural language queries) Revenue attribution modeling Predictive sales forecasting |
eCommerce and DTC brands without a dedicated data team that need quick, actionable insights |
| Northbeam | Multi-touch attribution platform | Attribution across multiple marketing channels
Customer journey tracking Marketing performance analysis |
Shopify and DTC brands focused on attribution accuracy |
| Triple Whale | eCommerce attribution and analytics | Multi-channel performance tracking
Attribution reporting eCommerce dashboarding |
Shopify stores seeking a centralized marketing analytics solution |
| Google Looker Studio | Business intelligence and reporting | Free reporting platform
Custom dashboards Strong integration with Google products |
Small businesses needing flexible, low-cost reporting |
| Klaviyo Analytics | Email and SMS marketing analytics | Email and SMS performance analysis
Campaign performance tracking Customer segmentation insights Retention-focused reporting |
Brands focused on improving email marketing and customer retention |
| GA4 (Google Analytics 4) | Website and user behavior analytics | User journey tracking
Event-based analytics Traffic and conversion reporting |
Businesses seeking detailed website performance and conversion insights |
Best Practices for Ongoing Channel Mix Analytics
Keep an eye on channel performance, validate channel attribution data, consistently measure key KPIs, and adjust budgets in real time based on insights. Continuous analysis can optimize ROI, customer acquisition, and adapt to market trends at a moment’s notice.
Establish a weekly analytics schedule
Marketing channel performance changes rapidly. Small problems don’t become expensive when they are reviewed weekly.
Break out new customer revenue and renewals revenue
Brands that fail to separate new and returning customer revenue often misjudge the effectiveness of their paid channels. ROAS is inflated for returning customers, and it is the actual ROAS for new customers.
Monitor LTV by acquisition source
The LTV of a customer acquired through TikTok can be as low as 30% compared to Google Search. This changes how you think about the CPA goals for each channel. Email and Google Search often drive the highest-LTV customers for most brands, since these channels target buyers who are actively searching for the brand or have a prior relationship with it.
Create a channel scorecard
If you have a monthly scorecard with 5–6 metrics for each channel, which you review consistently, you will see trend lines that snapshots of a single week won’t show.
Self-service Business Intelligence Tools
You don’t want your marketing team to have to raise a ticket with your data analyst each time they’d like to cross-tabulate performance by channel. Self-service BI features, such as those integrated into platforms like ProactiveAI, place that power in the hands of those who make decisions every day, reducing the time between data and action.
Don’t optimize channels in isolation
If a Meta campaign seems to have poor performance, it could be doing important top-of-the-funnel activities that make your Google Search campaigns look like superheroes. Channel mix decisions need to be made with a big-picture perspective, not optimized on a channel-by-channel basis.
Why ProactiveAI Is Built for eCommerce Channel Analytics
The common denominator among most ecommerce brands is that they have data but lack the infrastructure and staff to make decisions based on it. Most DTC brands lack the data engineers, BI developers, and maintenance personnel needed to build a proper omnichannel analytics dashboard from scratch.
That’s where ProactiveAI comes in. It integrates seamlessly with your ad platform, your email service, and your ecommerce site. It automatically dedupes and normalizes your revenues. The platform eliminates the need for SQL expertise, data warehouse setup, and analyst dependency while surfacing insights through an intuitive interface marketers can easily use.
From just a couple of people on a growth team to a 7-figure brand active in four channels, ProactiveAI provides you with the ecommerce clarity of channel ROI that you used to need to have an entire analytics team for.
Conclusion
eCommerce channel analytics is no longer a luxury reserved for enterprise brands with dedicated data teams. It’s a must-have skill for any DTC brand that is incurring real dollars on Meta, Google, TikTok, and email.
The brands that win aren’t the ones spending the most money; they’re the ones who know with certainty which channels to invest more in and which are burning quietly. This confidence is built on structured measurement, a consistent, unified data set, a normalized metric, deduplication, and a consistent attribution model across all channels.
Use the framework outlined in this guide to establish channel-specific metrics, normalize data, eliminate double-counting, and centralize reporting in a single source of truth. So, if you’re not looking to repeat the process every four months, why not let ProactiveAI handle it?
The aim was never to have more dashboards. It was a matter of good decisions.
Frequently Asked Questions
What is eCommerce channel analytics, and why does it matter?
eCommerce channel analytics involves monitoring and analyzing the performance of each channel, including Meta, Google, TikTok, email, and more, to determine its impact on revenue and customer acquisition. It’s important because if it didn’t exist, brands would waste money, overcompensate for poor-performing channels, and base growth decisions on inconsistent or incomplete information.
How do you compare performance across Meta, Google, TikTok, and email?
Compare all channels on a common basis to ROAS, such as normalizing to new customer acquisition cost (nCAC) or contribution margin, rather than each platform’s own ROAS. Leverage platform data, post-purchase surveys, and incrementality testing together to create a channel performance comparison that’s based on real business results and not attributed credit.
What is the best way to unify cross-channel analytics in one place?
Merge all channel APIs (Meta, Google, TikTok, Klaviyo, Shopify) into a single data layer, normalize, deduplicate revenue, and present everything in a single dashboard. Platforms such as ProactiveAI can streamline this entire process, eliminating the need for manual data engineering or complex BI workflows.
How do you prevent double-counting revenue across channels?
Remember to track revenue in your ecommerce backend (Shopify, WooCommerce), not from platform dashboards. Use one attribution model for all spend channels, perform holdout/incrementality testing on key spend channels, and validate post-purchase survey results against algorithmically attributed revenue.
Which channel typically drives the highest LTV customers for DTC brands?
For most DTC brands, the highest LTCs come from email and Google search. Email subscribers are more active and subscribed to more often, and Google Search gets users who are looking to buy. While paid social (Meta, TikTok) generates high new customer volume, this channel is generally associated with lower initial LTV, which means that channel mix is the key lever, not channel optimization.
You might also like
Handpicked articles for your reading list.


Get the latest insights on Conversational AI
Stay ahead of the curve with weekly updates on data analytics, AI trends, and eCommerce growth strategies delivered straight to your inbox.
Join 5,000+ industry leaders. Zero spam, just pure insights.