
 SparxIT
 SPXCommerce
 What's Your A



eCommerce
AI & Analytics
The Complete Guide to Automated Reporting for Modern Businesses
-
Varun Kumar
- Sep 10, 2026
- 8 mins read
Teams spend 12 hours creating the weekly revenue report, as someone has to export data from three tools and paste it into a spreadsheet, fix the formulas that have broken again, format it, and send it out, and then get a manager’s reply: “Can you also include a comparison to last month?”
Sound familiar? This is a common challenge for companies and marketing teams.. Manual reporting is time-consuming, cumbersome, and, let’s be honest, tedious. As your business expands, so do your data and your stakeholders, and your reporting backlog becomes a full-time job.
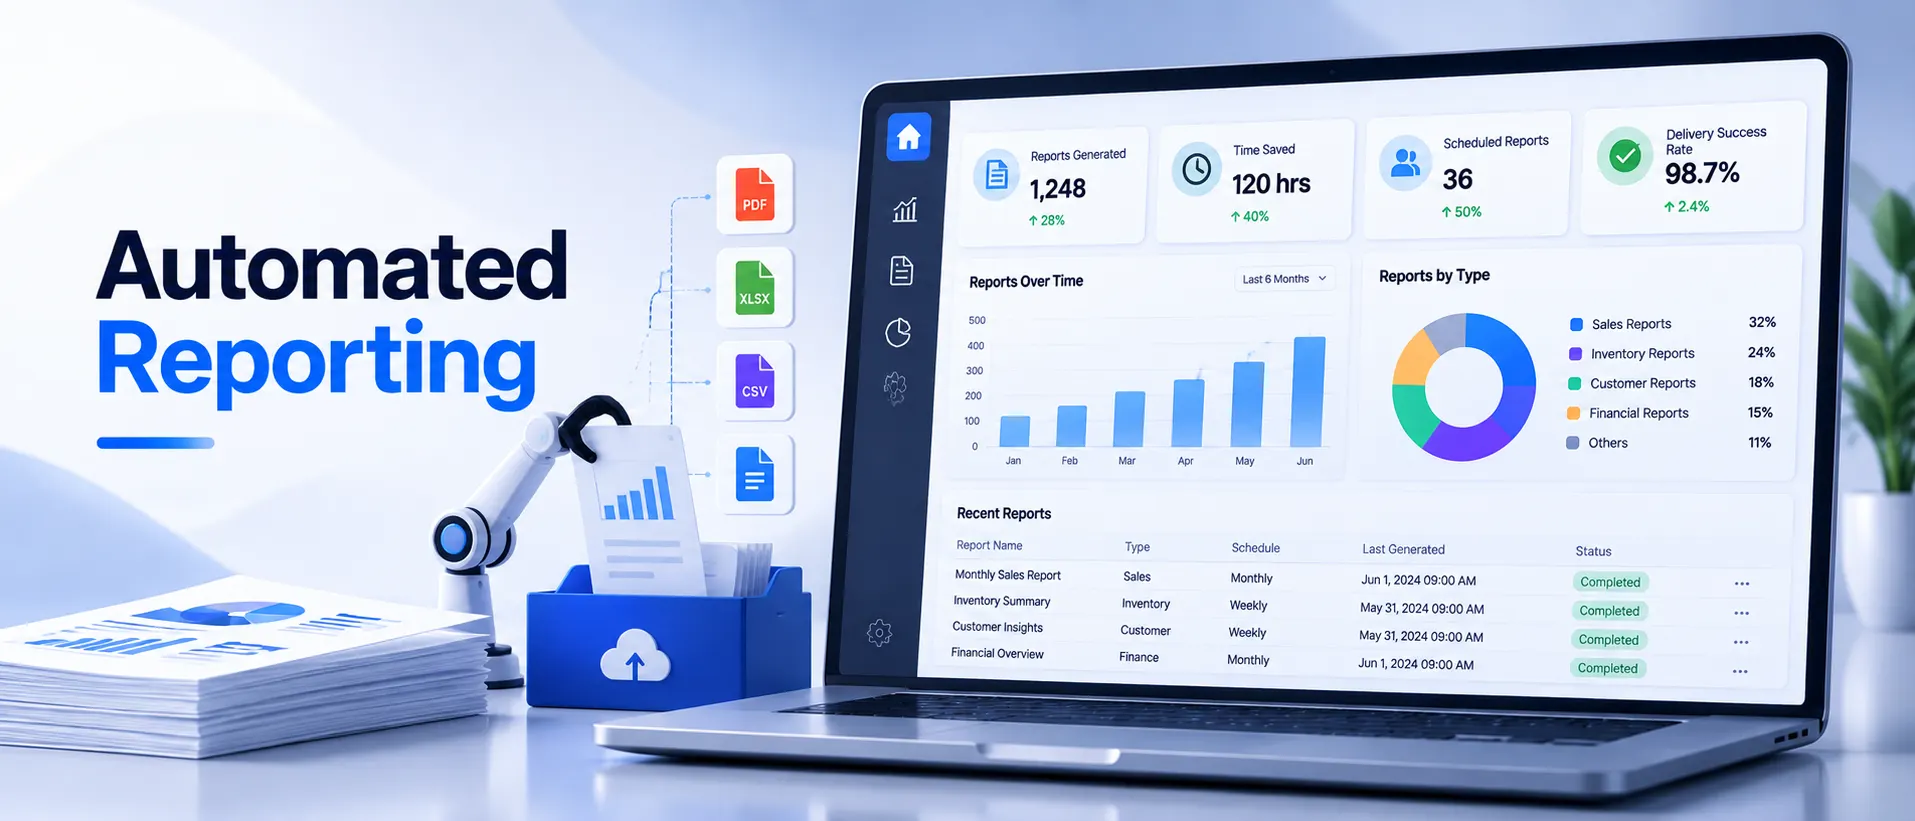
Automated reporting addresses this by connecting data sources, generating reports on a defined schedule, and delivering them automatically with consistent information. The business benefits as well: decision-makers receive insights when they need them, not 3 days later.
This guide will explain what automated reporting is, how to create it, what tools do it, and how to choose the right one for you.
What Is Automated Reporting?
Automated Reporting is the practice of automatically collecting information from connected sources, creating structured reports, and sharing them with the appropriate recipient(s) on a regular basis or at a certain event – without human effort.
The system does it for you instead of someone exporting the data, pasting it into slides every Monday morning, and then sending the PDF. What data, format, who, and when are defined once. After that, it is self-running.
But at scale, there’s a reason for that, as according to McKinsey reports, data professionals spend up to 80% of their time preparing data and building reports. It’s not a matter of selecting one tool and expecting it to work out. Specific layers need to be in place.
Automated reports and live dashboards serve different purposes. Reports deliver predefined information on a schedule or trigger, while dashboards provide an interactive view of current data. Automated reports are scheduled daily, weekly, and monthly and written to convey a narrative to a specific audience. A CEO doesn’t need a live feed, but they need a clean weekly summary that shows up in their inbox at 8 am. This is what automation provides.
What Are the Core Components of an Automated Reporting System?
An automated reporting system typically combines data connectivity, transformation, reporting, scheduling, distribution, and monitoring layers.
1. Data Sources and Connectors
All automated reports begin with data. Your system must connect to where that data lives: CRM, advertising, ERP, database, spreadsheet, ecommerce, or data warehouse. Strong native connectivity can reduce manual data integration, provided the connectors support reliable synchronization and the required data transformations.
2. Data Processing and Transformation
Raw data from a source system is rarely report-ready. Cleaning, joining, and aggregation are usually involved in calculating totals, filtering date ranges, converting currencies, and flagging anomalies. This layer should support reusable transformations through visual workflows or SQL, depending on the team’s technical requirements.
3. Report templates and visualization
The report should define its metrics, layout, charts, tables, and presentation logic in a reusable template. Seamless automated reporting applications enable you to create templates and run them over time, area, and business unit without having to develop them again.
4. Scheduling and Trigger Logic
Scheduling and trigger logic determine when reports should run and under what conditions. You determine the cadence (hourly, daily, weekly, monthly), or you can also set event-based triggers (such as “run this report when the revenue goes under threshold”). The system uses that schedule and doesn’t require anyone to push a button.
5. Delivery and Distribution
Reports must be delivered to individuals. This means that the email is sent to recipients, published to a shared portal, exported to PDF/Excel/CSV, or pushed to a Slack channel. Good distribution logic also covers role-based access, which lets the sales team see only their region’s information, not everybody else’s.
6. Monitoring and Failure Alert
Automated isn’t synonymous with unmonitored. Good systems alert you if a scheduled report fails to complete, a data source connection breaks, or report outputs include unexpected values.
What Types of Automated Reports Exist?
Not all automated reports are created equal. Below are the key categories:
1. Scheduled Operational Reports
This is the most common type of reporting. They are run on a set schedule, like weekly sales summaries, monthly financial statements, or daily inventory snapshots, and delivered to a set list of stakeholders. The content is consistent, with the only change being the data.
2. Exception and Alert Reports
These are not time-based triggers, but rather condition-based. An alert report is triggered when the customer acquisition cost drops by 40% in a day. When the product is sold out, operations is notified. These are valuable because they surface issues a human might miss.
3. Executive and Board Reports
These are usually run monthly or quarterly and aggregate KPIs across business functions. They must be clear, concise, and easy to understand, and they are intended for non-technical audiences. Automation ensures they aren’t held back by a data analyst’s workload.
4. Compliance and Audit Reports
Industries with strict reporting requirements include finance, healthcare, and legal. Automated compliance reporting can improve consistency and traceability when supported by appropriate access controls, audit logs, data lineage, and retention policies.
5. Client and External Reports
Agencies, consultancies, and SaaS firms frequently have to create reports for their clients. Automation lets you “white label” and customize reports for every client without rebuilding them each cycle.
What Tools and Platforms Power Automated Reporting?
Expand the comparison criteria beyond “Best For” and “Key Strength” to include integrations, scheduling, transformation, governance, AI capabilities, scalability, and pricing approach.
| Tool | Best For | Key Strength |
| ProactiveAI | AI-powered analytics + conversational reporting | Natural language queries, AI-driven insights, self-service BI |
| Looker / Looker Studio | Google ecosystem users | Deep BigQuery integration |
| Power BI | Microsoft-centric organizations | Excel familiarity, enterprise licensing |
| Tableau | Visual analytics teams | Advanced charting capabilities |
| Funnel.io | Marketing data aggregation | 500+ marketing data connectors |
| Glew.io | Ecommerce analytics | Ecommerce KPI dashboard, multi-channel data |
One tool that deserves special mention is ProactiveAI, which doesn’t take the traditional automated-reporting route. Instead of users having to create their own dashboards, ProactiveAI lets you ask a question in natural language and receive a structured report as the answer. Interested in finding out what product category generated the highest revenue this past quarter? Ask it. Looking for a weekly summary of your best campaigns? Schedule a time to discuss it. Where traditional BI tools have a heavy learning curve, ProactiveAI fills a genuine gap for teams seeking self-service analytics.
Its AI dashboard builder adapts reports to the available business context and can surface relevant patterns or insights beyond predefined queries.
What Are the Best Practices for Automated Reporting?
Automation magnifies the process that you put in. But when your reporting logic is correct, automation makes it faster. If it’s broken, it will spread incorrect numbers to more people, faster.
1. Start with the audience, not the data
When you are setting up a report, ask the following questions: Who will receive this report? What decision does it help to make? What is the minimum amount of information they need? A report that contains a lot of numbers and appears all-knowing is seldom read.
2. Define KPIs explicitly before automation
Automation is based on pre-programmed logic. If KPI definitions are not standardized, different reports may apply inconsistent logic to metrics such as conversion rate or active customers.
3. Use parameterized templates
Don’t prepare an individual report for each region or product line; prepare one template with dynamic filters. The system produces 12 region-based reports from a template. This lets you scale without turning report maintenance into a nightmare.
4. Test data connections periodically
The most common causes of automated reports silently breaking include changes to the data source schema, API updates, and credential expiration. Develop a monitoring system to detect these issues before stakeholders do.
5. Maintain up-to-date distribution lists
Automated reports sent to the wrong team or employee only add confusion and security risks. Review recipient lists regularly and whenever teams, roles, reporting structures, or access requirements change.
6. Do not automate something that is broken
When manual reporting is already flawed or doesn’t meet business requirements, automation only makes flawed reports faster. Automate only after fixing the root-cause process.
How Do You Choose the Right Automated Reporting Solution?
Dozens of tools promise to automate reporting, but for whom, and for what?
Let’s take a practical approach:
1. Who are your report consumers?
Executives need a clean PDF in their inbox, and technical teams need someone comfortable with SQL and dashboards. ProactiveAI and Looker Studio are better for business users, while dbt or custom Python extensions are more data-engineer-oriented.
2. What is the location of your data?
If you’re using data across 15 platforms, you need a tool with native connectors or a standalone data integration solution that pushes data into a warehouse. The plumbing isn’t as simple as it looks.
3. What’s your delivery requirement?
The infrastructure differences between email delivery, shared portals, Slack notifications, and embedded reports are different. Ensure reporting reaches your stakeholders where they’re looking.
4. Do you need AI-powered insights or just scheduled delivery?
Deliveries are taken for granted these days. AI analytics tools such as ProactiveAI offer value over BI tools in identifying anomalies, providing insights, and answering ad hoc questions.
5. What is the total cost of ownership?
Most tools are inexpensive for 5 users, but expensive for more. Consider connector expenses, user seats, and engineering hours to maintain the system.
Ecommerce analytics dashboards and predictive sales analytics are more efficient for ecommerce businesses since they don’t require creating industry-specific metrics from scratch.
Why ProactiveAI Is Built for the Way Modern Teams Report
ProactiveAI transforms business reporting by delivering more conversational, accessible, and actionable business analytics. Teams can ask questions in natural language and receive structured answers based on their business data, with no complex dashboards or analysts needed to create reports.
It automatically creates reports and lets you set up reports to run on a regular schedule, with a recipient, and send them automatically without manual intervention. This saves teams time on report creation and frees up more time to act on the reporting information.
Not only for historical reporting, but ProactiveAI also forecasts revenue, helping sales and finance teams understand not just what happened, but what could happen. Its analytics capabilities are another advantage for e-commerce businesses, as it integrates acquisition, retention, revenue, and customer lifetime value to deliver a comprehensive view of overall performance.
When manual reporting takes too much time, ProactiveAI provides a smarter solution to turn business data into timely, effective insights.
Conclusion
Automated reporting isn’t simply a way to save a few hours a week, and it’s an integral part of how modern businesses operate. Teams can link data sources, set up consistent reporting processes, automate data distribution, and reduce manual workload to provide decision-makers with accurate data anytime, anywhere.
It’s all about strategic automation. Start with repeatable, time-consuming, and business-critical decision-making reports. Define your KPIs, optimize your data flow, choose the right reporting tool, and implement monitoring from the start.
Automated reporting is no longer about reporting numbers on a fixed schedule in today’s fast-changing world of AI-driven analytics. Chatbots like ProactiveAI let businesses get answers to their queries in a natural way, detect patterns and anomalies, generate regular reports, and turn raw business data into actionable insights.
The goal is not to replace human decision-making, but to reduce repetitive reporting work so teams can focus on interpreting data and making informed decisions. Reporting is no longer a tedious task when your team can devote more time to understanding the story behind the numbers. This becomes a competitive advantage.
Frequently Asked Questions
What is the difference between automated reporting and a live dashboard?
Automated Reporting delivers clear, regular reports to stakeholders. A live dashboard displays real-time data for real-time monitoring. Both have advantages and disadvantages, but they suit different uses: one for periodic communication and the other for operational transparency.
How long does it take to set up automated reporting?
Today, you can produce an automated report in just a few minutes using the latest equipment. These more complex cases involving several data sources, custom transformations, and conditionals can often take days to weeks, depending on the maturity of the data infrastructure.
Can automated reporting replace a data analyst?
No, if anything, it shifts the focus of the analyst. Automated reporting manages the repetitive task of creating and sending reports, allowing analysts to concentrate on analysis, modeling, and strategy. The analyst’s role is shifting from report maker to insight advisor.
Is automated reporting secure for sensitive business data?
Yes, if you choose properly controlled tools. Look for role-based access control, encryption, audit trails, and SSO integration. Sensitive financial or customer information should never be shared in a way that exposes it to unrestricted access by wide audiences without proper access controls.
What happens when an automated report fails?
An automated reporting system should notify the report owner of failures if a report is not completed when scheduled. It is recommended that additional monitoring be performed to detect data source disconnections, schema changes, or delivery failures before stakeholders realize reports are not being delivered.
Which industries benefit most from automated reporting?
Industries such as ecommerce, SaaS, financial services, healthcare, and marketing services can benefit significantly from automated reporting because they often manage multiple data sources and recurring reporting requirements. These sectors report often, have multiple data sources, and require consistent, timely data for stakeholders making rapid decisions.
You might also like
Handpicked articles for your reading list.

Get the latest insights on Conversational AI
Stay ahead of the curve with weekly updates on data analytics, AI trends, and eCommerce growth strategies delivered straight to your inbox.
Join 5,000+ industry leaders. Zero spam, just pure insights.