

eCommerce
Marketing
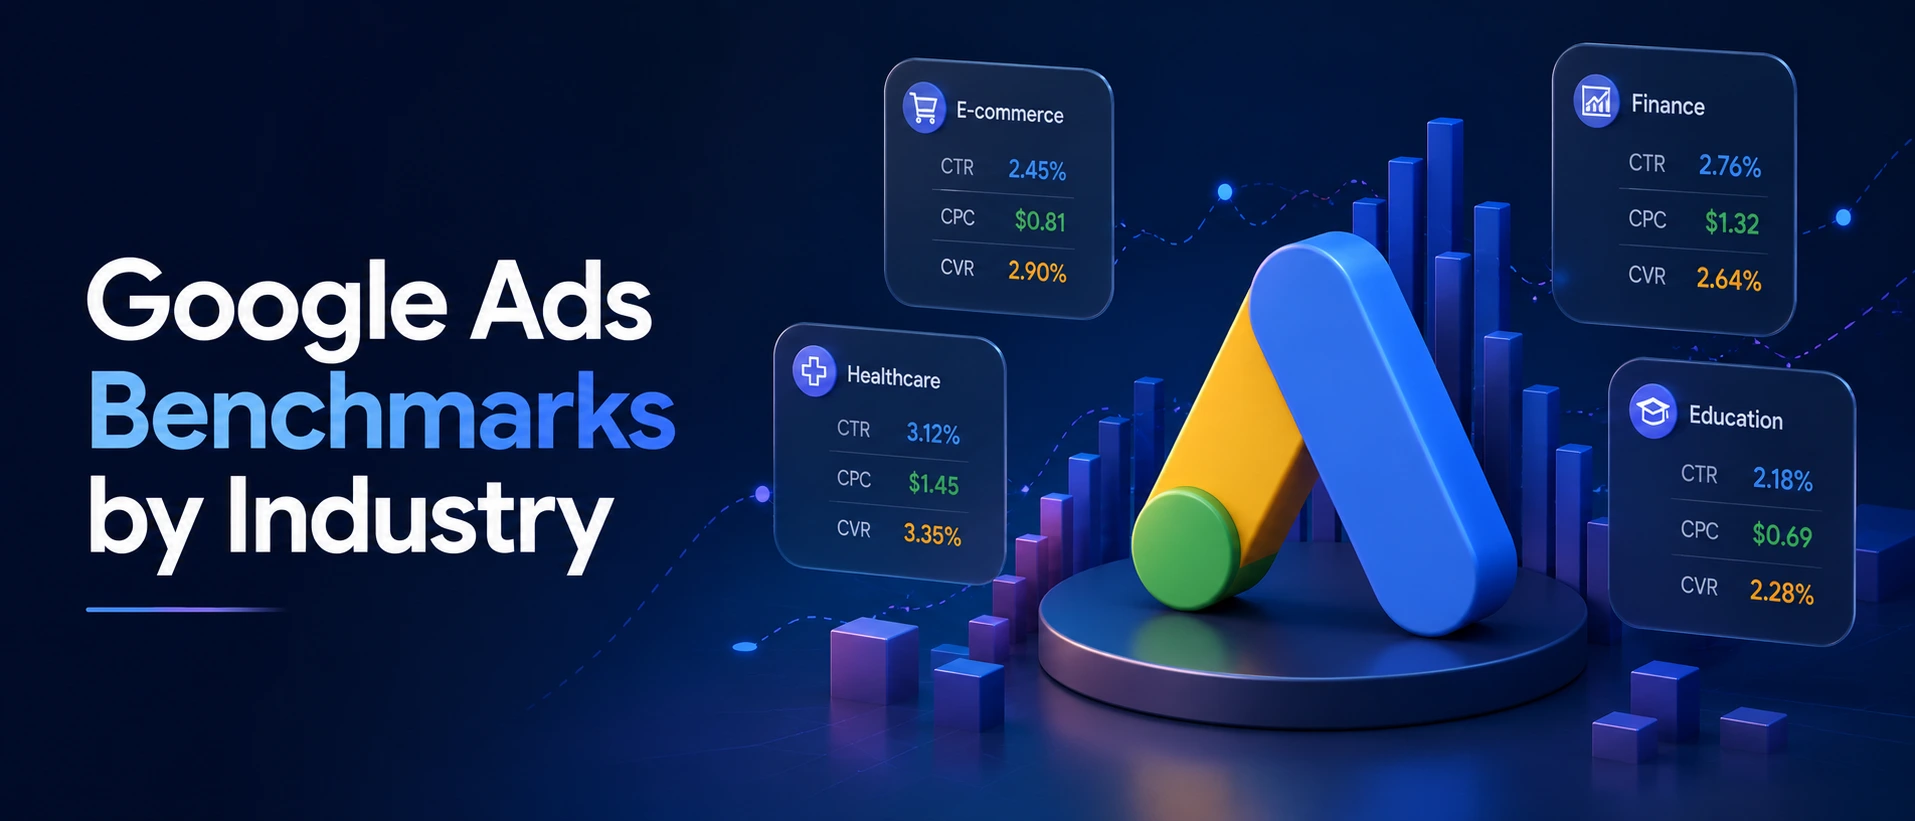
Google Ads Benchmarks by Industry (2026 Updated Data)
-
Varun Kumar
- Jun 05, 2026
- 8 mins read
You’ve created your Google Ads campaign. You’re getting clicks, and the budget is working, but is that a sign of good performance, or are you simply wasting?
It’s one of the most common and costly challenges for digital marketers and business owners alike. Without benchmarks, it becomes difficult to determine whether a campaign is performing well. You may have a 2% conversion rate while others in your industry achieve 6% or higher. Or you may be worried about a $4.00 CPC, which is considered normal for your niche.
Google Ads benchmarks help you measure campaign performance against industry standards. They provide a clear view of industry performance, showing where you stand, where gaps exist, and where optimization opportunities lie. When combined with a smart analytics platform such as ProActiveAI, these benchmarks evolve from guesswork to data-driven, proactive decision-making.
In this guide, we’ve compiled the latest Google Ads performance benchmarks for 2026 across more than 15 industries. Explore average CTR, CPC, conversion rates, CPA, and ROAS benchmarks all in one place to better evaluate and optimize your campaigns.
What Are Google Ads Benchmarks?
Google Ads benchmarks represent average industry performance across key advertising metrics such as CTR, CPC, CVR, CPA, ROAS, and CPM.
The idea is like a grading curve. Scoring 75% on an exam sounds mediocre until you realize the class average was 60%. Benchmarks serve a similar function for your ad performance. They don’t set your targets, but they focus your thinking on what is ordinary, what is extraordinary, and what needs to be fixed now.
5 Key Metrics That Define Google Ads Performance
Before getting into the numbers, it’s important to understand what each metric measures and why it matters to the bottom line.
| Metric | Full Form | What It Measures |
| CTR | Click-Through Rate | Measures how relevant and engaging your ads are to what people are looking for. |
| CPC | Cost Per Click | The amount you pay each time a user clicks on your ad. |
| CVR | Conversion Rate | The proportion of visitors who reach a target action or conversion event. |
| CPA | Cost Per Acquisition | The average cost to acquire a lead or customer. |
| ROAS | Return on Ad Spend | The profit generated for every $1 spent on advertising. |
Understanding the Metrics in Plain Terms
- For most search campaigns, CTR > 3% is considered good. Because of passive viewing behavior, display campaigns naturally have lower view rates (0.5–1.2%).
- CPC varies significantly across industries, ranging from $1.16 in ecommerce to more than $6.75 in legal services. This is a measure of keyword competition and the value of a converted customer.
- CVR reflects how effectively your landing page and offer convert visitors into customers or leads. If the CVR is high, it suggests that your ad offer and landing page delivery align.
- CPA is the truest measure of campaign efficiency. A $150 CPA could be great for a SaaS business with a $ 2,000 LTV, but disastrous for a $30 product.
- A 4× ROAS means you earn $4 for every $1 spent. E-commerce brands typically target 3–5×, subscription models often prioritize customer LTV over immediate ROAS.
Google Ads Average CTR by Industry 2026
There’s a reason it is usually the first metric marketers look at: Click-through rate. If visitors aren’t clicking your ads, it means you need to improve your ad copy, keyword targeting, or audience match.
| Industry | Avg CTR (Search) | Avg CTR (Display) | Performance |
| Travel & Hospitality | 4.68% | 0.47% | High |
| Advocacy | 4.41% | 0.59% | High |
| Auto | 4.00% | 0.60% | High |
| E-Commerce | 4.10% | 0.59% | High |
| Real Estate | 3.71% | 1.08% | Mid |
| Home Goods | 3.71% | 0.49% | Mid |
| Industrial Services | 3.37% | 0.50% | Mid |
| Health & Medical | 3.27% | 0.59% | Mid |
| Education | 3.78% | 0.53% | Mid |
| B2B | 3.00% | 0.46% | Mid |
| Legal | 2.93% | 0.59% | Lower |
| Finance & Insurance | 2.91% | 0.52% | Lower |
| Consumer Services | 2.41% | 0.51% | Lower |
| Employment Services | 2.42% | 0.46% | Lower |
| Technology | 2.09% | 0.39% | Lower |
Google Ads Average CPC by Industry (2026)
Cost Per Click (CPC) reflects keyword competition and the amount advertisers are willing to pay to secure a click. Legal and consumer services typically have the highest CPCs, while ecommerce and travel campaigns often operate with lower click costs.
| Industry | Avg CPC (Search) | Avg CPC (Display) |
| Legal | $6.75 | $0.72 |
| Consumer Services | $6.40 | $0.81 |
| Technology | $3.80 | $0.51 |
| Finance & Insurance | $3.44 | $0.86 |
| B2B | $3.33 | $0.79 |
| Home Goods | $2.94 | $0.60 |
| Health & Medical | $2.62 | $0.63 |
| Industrial Services | $2.56 | $0.54 |
| Auto | $2.46 | $0.58 |
| Education | $2.40 | $0.47 |
| Real Estate | $2.37 | $0.75 |
| Employment Services | $2.04 | $0.78 |
| Travel & Hospitality | $1.53 | $0.44 |
| Advocacy | $1.43 | $0.62 |
| E-Commerce | $1.16 | $0.45 |
Not all high CPCs are lower ROAS. If one customer pays thousands of dollars for a legal firm’s services, then they can generate outstanding returns with a $6.75 click cost. The real measures you should focus on are your CPA and ultimate ROAS as they relate to LTV.
Google Ads Conversion Rate Benchmark by Industry 2026
Conversion rate reflects how effectively your landing page supports your ad targeting strategy. This is a good indicator that your offer is compelling for the visitors who are clicking on your ads. We’ve seen that service-based industries with quick, clear purchase motivations (E.g., service-related) have always had and will have higher raw CVR than eCommerce.
| Industry | Avg CVR (Search) | Avg CVR (Display) |
| Legal | 6.98% | 1.84% |
| Auto | 6.03% | 1.19% |
| Employment Services | 5.13% | 1.57% |
| Finance & Insurance | 5.10% | 1.19% |
| Consumer Services | 5.00% | 1.19% |
| Travel & Hospitality | 3.55% | 0.51% |
| Education | 3.39% | 0.50% |
| Industrial Services | 3.37% | 0.94% |
| Health & Medical | 3.36% | 0.82% |
| B2B | 3.04% | 0.80% |
| E-Commerce | 2.81% | 0.59% |
| Home Goods | 2.81% | 0.43% |
| Real Estate | 2.47% | 0.80% |
| Technology | 2.31% | 0.86% |
| Advocacy | 1.96% | 1.00% |
In the world of ecommerce, an average CVR of 2.81% may seem modest, but when it comes to high-volume e-commerce and repeat customers, it’s a powerful economic force. While tracking conversion rate, make sure to also track average order value and customer lifetime value.
Google Ads CPA Industry (2026)
Cost per acquisition is the ultimate measure of actual cost efficiency. This metric answers a simple question: ‘How much did it cost to acquire a customer or qualified lead? This is the one that’s important to CFOs and business owners.
| Industry | Avg CPA (Search) | Avg CPA (Display) |
| Technology | $133.52 | $103.60 |
| B2B | $116.13 | $130.36 |
| Advocacy | $96.55 | $70.69 |
| Consumer Services | $90.70 | $60.48 |
| Home Goods | $88.80 | $71.88 |
| Legal | $86.02 | $39.52 |
| Finance & Insurance | $81.93 | $56.76 |
| Industrial Services | $79.28 | $51.58 |
| Health & Medical | $78.09 | $72.58 |
| Real Estate | $66.02 | $41.14 |
| Employment Services | $48.04 | $59.47 |
| Education | $45.56 | $48.96 |
| Travel & Hospitality | $45.28 | $33.17 |
| E-Commerce | $45.27 | $65.80 |
| Auto | $33.52 | $23.68 |
B2B and technology industries have the highest CPA, which is to be expected as one closed deal can equate to $10,000 to $100,000 in contract value. The auto and travel industries benefit from faster buying decisions and lower friction, which often contributes to lower CPAs.
Google Ads ROAS Benchmark 2026
For performance marketers, the one metric that really matters is ROI on ad spend. ROAS data is more difficult to standardize, but the 2026 estimates still give advertisers an idea of where they’re getting the best return on their investment.
| Industry | Avg ROAS (Estimate) | Context |
| Travel & Hospitality | 5.2× | Short funnel, high repeat intent |
| E-Commerce | 4.8× | High volume, repeat purchases |
| Auto | 4.5× | High-ticket, quick decision cycle |
| Real Estate | 4.3× | High-value single transactions |
| Employment Services | 4.2× | Recurring placement fees |
| Consumer Services | 4.0× | Strong local intent |
| Home Goods | 4.0× | Seasonal spikes boost ROAS |
| Finance & Insurance | 3.9× | High LTV per client |
| Industrial Services | 3.8× | B2B contract values |
| Education | 3.7× | Long enrollment cycle |
| Health & Medical | 3.6× | High trust requirement |
| Legal | 3.4× | High CPC offset |
The basic rule is that a ROAS of 3× or more is generally considered viable, but the “right” ROAS varies with the gross margins of your business model. If your product margin is only 15%, then a 4x ROAS is no better than a 15% profit. Your break-even ROAS equals 1 divided by your gross margin expressed as a decimal.
Google Ads CPM Benchmark (Display & YouTube-2026)
The main model of buying for display and YouTube is cost per thousand impressions (CPM). CPM ads are generally priced based on visibility and brand awareness, whereas search ads are pay-per-click.
| Campaign Type | Avg CPM Range | Best Use Case |
| Google Display Network | $0.50 – $3.00 | Retargeting, brand awareness |
| YouTube Skippable Ads | $3.00 – $10.00 | Video storytelling, mid-funnel |
| YouTube Non-Skippable | $10.00 – $30.00 | High-impact product launches |
| Gmail Sponsored Ads | $2.00 – $6.00 | Competitive conquesting |
| Responsive Display Ads | $1.50 – $5.00 | Scalable awareness campaigns |
The precision of the target significantly impacts CPM. What narrow demographic targeting or remarketing audiences do is boost CPM while simultaneously greatly enhancing downstream conversion quality, so it’s more than worth the extra expenditure on CPM!
Best Practices to Improve Your Google Ads Performance
Benchmarks indicate the difference, so here are some strategies to help you close it.
1. Sharpen Keyword Intent
Map keywords to specific stages of the buyer journey. If you are looking to drive higher conversions and CTRs, you should always consider using bottom-funnel keywords, like “buy,” “hire,” or “near me. While they may cost more per click, they are always proven to have higher conversions and CTRs.
2. Write Benefit-First Ad Copy
Be customer-centric by talking about what the customer needs, rather than your product features. In many cases, ‘Get Your Tax Refund Faster’ performs better than ‘Professional Tax Services’ because it highlights a customer benefit.
3. Optimize Quality Score
A better Quality Score will lead to a lower CPC and a higher ad position. Incorporate landing pages that are closely related to ad copy.
4. Optimize for Mobile First
Mobile devices account for a significant share of Google Ads traffic, making mobile optimization essential. The number one unnoticed CPA killer for most advertisers is slow mobile landing pages.
5. Layer Remarketing Audiences
Retarget to engage visitors who have previously visited your website with a personalized message. Remarketing campaigns can consistently outperform cold audience campaigns by 2-4x in CVR.
6. Use Analytics Attribution
Attribution data, alongside predictive sales analytics, can help marketers forecast future campaign performance and identify which campaigns are most likely to sustain long-term revenue growth. Last-click attribution often provides an incomplete picture. Use multi-touch attribution to understand how each campaign contributes to revenue.
When Your Numbers Are Below the Benchmark:
- CTR below benchmark: Rewrite ad headlines. Test new value propositions. Include extensions, such as sitelinks, callouts, and structured snippets.
- CPC above benchmark: Improve Quality Score. Narrow keyword targeting. Try long-tail and less-competitive keywords.
- CVR below benchmark: Do an audit of your landing page. Reduce form friction. Match the landing page headline to the particular ad that drove the traffic.
- CPA above the benchmark: CPA above benchmark: Pause underperforming ad groups and reallocate budget to top-performing campaigns. Tighten audience targeting.
- ROAS below target: Review product profitability. Consider excluding low-margin products from campaigns.
Why ProActiveAI Is the Analytics Partner Your Google Ads Strategy Needs?
Many businesses rely solely on Google Ads reporting, which can make it difficult to gain a complete view of overall marketing performance and ROI. That changes all with ProActiveAI.
We are an independent analytics intelligence platform, providing you with a seamlessly integrated view of all of your paid channels (Google Ads, Meta, LinkedIn, etc.) and organic, email, and direct traffic. Instead of viewing channels in isolation, you can track the complete customer journey across touchpoints.
Additionally, our platform uses natural language bi capabilities to make complex advertising data easier to understand, enabling teams to find insights that can guide action without spending a ton of time manually processing it.
With the evolving advertising landscape, businesses are increasingly seeking to integrate campaign reporting, attribution, and profitability analysis across all marketing channels through AI business intelligence solutions.
Frequently Asked Questions
What is a good CPA for Google Ads?
The average CPA for Google Ads varies by product type, industry, and profit margins. In general, a good CPA allows you to acquire customers profitably while maintaining healthy margins.
What is the average ROAS for Google Ads in 2026?
The industry average ROAS for Google Ads in 2026 is 2:1 to 4:1. A campaign that targets the right audience and uses optimized landing pages and creative assets can achieve significantly higher ROAS.
Which industry has the lowest CPA on Google Ads?
Industries such as ecommerce and education often report lower CPAs because they serve broader audiences and face fewer acquisition barriers. Acquisition cost may be much higher in competitive industries such as legal, finance, and insurance.
How do Google Ads benchmarks compare to Meta?
Google Ads tends to have stronger purchase intent, as users are actively looking for a product or service and are more likely to convert. Meta Ads, however, are great for audience discovery, brand awareness, and engagement at the top of the funnel for lower costs.
You might also like
Handpicked articles for your reading list.
Get the latest insights on Conversational AI
Stay ahead of the curve with weekly updates on data analytics, AI trends, and eCommerce growth strategies delivered straight to your inbox.
Join 5,000+ industry leaders. Zero spam, just pure insights.