


AI & Analytics
eCommerce
Cohort Analysis for Ecommerce: How to Track & Improve Retention
-
Vikash Sharma
- Jun 07, 2026
- 9 mins read
You’re driving heavy advertising traffic but seeing low repeat purchases. Sound familiar? Their top customers are incrementally sitting on the sidelines without them even realizing it, while most ecommerce brands are focused on acquisition. Cohort analysis helps uncover these retention issues before they impact long-term growth.
But it’s 5–7 times more expensive to acquire a new customer than keep an existing one, and most of your ecommerce dashboards tell you how many customers you’ve acquired, not how many you’ve retained, returned, and spent more. Without cohort analysis, you lose visibility into one of the most important drivers of profitability: customer retention.
Cohort retention data is also becoming an essential metric in the realm of AI in business intelligence, and ecommerce organizations can use this metric to directly link customer behavior to profitability.
Cohort analysis is no longer limited to data scientists working with complex SQL environments. Any ecommerce team, with proper implementation and platforms like ProactiveAI, can gain these insights, identify drop-offs, and implement targeted solutions that will significantly impact lifetime value (LTV).
In this guide, you will learn what cohort analysis is, how to read a cohort retention grid, real-life ecommerce examples, and how to set it all up without hiring a data engineering team.
What Is Cohort Analysis?
Cohort analysis is a behavioral analytics method that groups users by a shared characteristic, such as their first interaction with your brand, and tracks their behavior over time. Instead of analyzing all customers together, you track how specific customer groups behave over time.
A cohort is a group of people who share a common starting point, usually their initial purchase date, that can be measured over a specific period of time. The main difference is that cohort analysis tracks customer behavior after a defined starting event, while segmentation groups customers based on shared attributes at a specific point in time.
While your aggregate metrics provide information about your customers, customer cohort analysis addresses questions that those metrics can’t answer:
- Did people who were targeted by Instagram ads come back for a second purchase in Q1?
- Are the LTVs of holiday shoppers equal to those of organic-search shoppers?
- Did our post-purchase email sequence really help with our month 2 retention?
- Which acquisition channel brings in customers that generate the most revenue over the course of a 12-month period?
Why Ecommerce Brands Can’t Ignore It?
Repeat purchases are the lifeline of ecommerce businesses. One-time buyers typically contribute less to long-term profitability than repeat customers. Cohort retention analysis reveals which customer segments continue purchasing and which experience a significant drop-off after the first order.
If you don’t do cohort analysis, you could end up with:
- Total revenue may increase even as cohort retention declines, creating a misleading impression of growth.
- Poorly targeted advertising spend investing in low LTV traffic channels
- Customer churn becomes difficult to identify and address.
- Product-market fit blind spots can hide retention issues within specific products or categories.
Types of Cohort Analysis
In ecommerce, there are two main types of cohort analysis that show varying aspects of customer behavior:
Acquisition Cohorts (Most Common)
These cohorts group customers by their first purchase date, such as all customers who made their first purchase in January 2026. Then you see what percentage you get back at month 1, month 2, month 3, and so on. This is the core of the ecommerce cohort retention analysis.
Behavioral Cohorts
These cohorts group customers based on specific actions rather than when they joined. For example: “Customers who applied a discount code on their first purchase” vs. “Customers who paid full price. Behavioral cohorts help teams test assumptions and identify actions that influence long-term customer loyalty.
| Cohort Type | Grouped By | Best For | Example Question |
| Acquisition Cohort | First purchase date | Retention tracking, LTV by channel | Do Jan buyers return more than Jun buyers? |
| Behavioral Cohort | Specific action taken | Feature or campaign impact testing | Do loyalty program members churn less? |
| Channel-Based Cohort | Acquisition source | ROAS and CAC optimization | Do Meta vs. Google shoppers have higher LTV? |
| Product-Based Cohort | First product purchased | Identifying hero SKUs | Which product drives the highest repeat rate? |
Step-by-Step Process on How to Do Cohort Analysis?
If you don’t have a data science degree, here’s a straightforward, practical approach to conducting your first cohort analysis.
Identify your cohort dimension: Decide which type of cohorts you will use for your customers: First purchase month, acquisition channel, promo usage, product category.
Measure your metric: What are you measuring? Retention rate, revenue per cohort, repeat purchase rate, or Average Order Value (AOV) by months?
Set your time window: In ecommerce, monthly analysis is the most common approach. High-frequency categories such as consumables and subscriptions often require weekly cohort tracking.
Pull & structure your data: You will need a transaction-level dataset that contains: Customer ID, date of first order, subsequent order dates, and revenue. This is auto-structured by ProactiveAI’s solution using your store information.
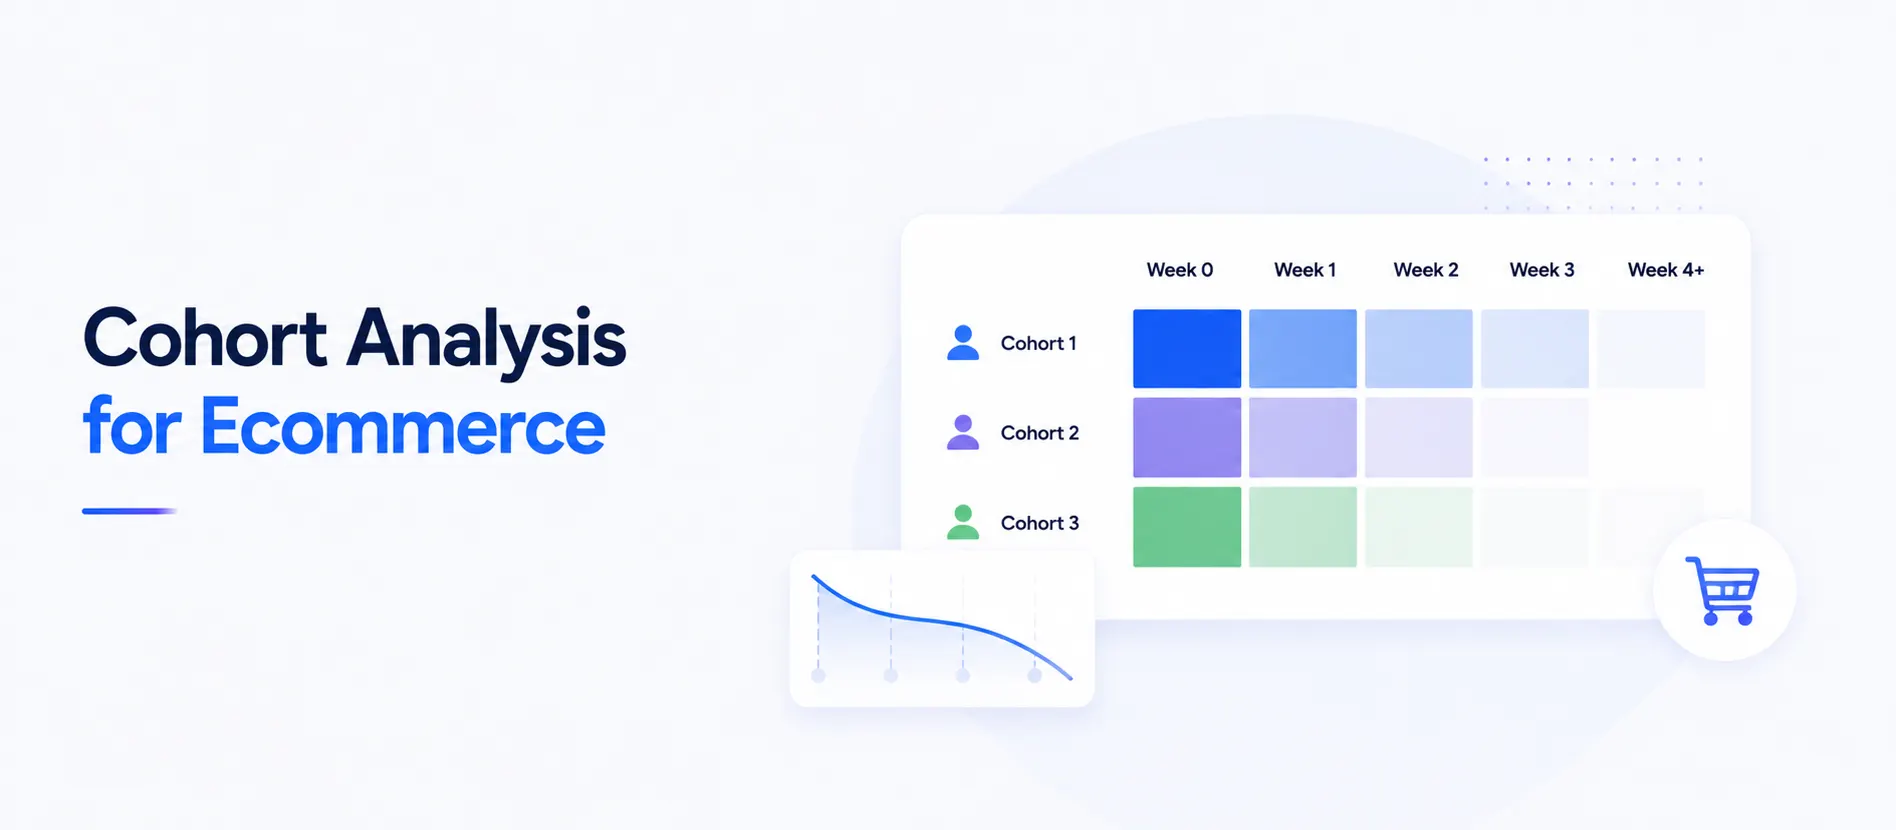
Construct your retention grid: On the Y-axis, add cohorts (Month Joined) and on the X-axis add the time periods (Month 0, 1, 2…). The % of the cohort that returned in each period is displayed in each cell.
Look for patterns and anomalies: Identify cohorts with significantly higher or lower retention rates. What was so special about those months? Channel mix? Promotions? Product launches?
Take action on findings: Apply insights to refine onboarding sequences, loyalty programs, retargeting, and product recommendations for low-retention segments.
Retention Rate = (Customers who returned in period N ÷ Cohort size at Month 0) × 100
Month 0 = Actual 1st purchase month (100%)
Month 1 = % of the same cohort that re-purchased the next month
Month N = % still active N months after acquisition
Cohort Analysis Example: Reading a Retention Grid
Let’s walk through a real-world cohort analysis example. Imagine a Shopify fashion store. Here’s what their monthly retention grid might look like:
| Cohort (Join Month) | Month 0 | Month 1 | Month 2 | Month 3 | Month 4 | Month 5 |
| Jan 2026 | 100% | 32% | 18% | 14% | 9% | 8% |
| Feb 2026 | 100% | 24% | 12% | 9% | 5% | — |
| Mar 2026 | 100% | 38% | 22% | 16% | — | — |
| Apr 2026 | 100% | 28% | 15% | — | — | — |
| May 2026 | 100% | 41% | — | — | — | — |
What does this tell us?
- The March 2026 cohort shows a significantly higher retention rate of 38%, warranting further investigation. Was there a loyalty program or a product launch in that month?
- The February 2026 cohort experiences a sharp decline in Month 4, potentially driven by seasonal one-time purchasers.
- Month 1 looks strong for May 2026 at 41%, which may be due to the new welcome email sequence launched in May.
- There is a significant drop from Month 0 to Month 1 across all cohorts, indicating the need for a more effective post-purchase nurturing plan for this brand.
Cohort Analysis on Shopify
Shopify Plus offers native cohort analysis in its Analytics section, making it easy to track customer retention by acquisition date. However, its functionality is relatively limited compared to dedicated analytics tools.
It lacks advanced behavioral segmentation, multi-channel data integration, and in-depth drill-down capabilities, which can restrict deeper customer lifecycle analysis. The comparison below highlights Shopify’s cohort analysis capabilities and limitations:
| Feature | Shopify Native | ProactiveAI Integration |
| Acquisition date cohorts | Yes | Yes |
| Behavioral cohorts | No | Yes |
| Channel-based cohorts | No | Yes |
| Tracking LTV per cohort | Limited | Full |
| Cross-platform data blend | No | Yes |
| Exportable cohort template | Basic CSV | Rich export + dashboards |
| If a drop in retention is detected, an alert is generated | No | Yes |
If you have a serious ecommerce business, whether you’re on Shopify, WooCommerce, or BigCommerce, having a dedicated analytics platform like ProactiveAI will offer you the depth that native store analytics cannot.
Teams can track retention, repeat purchases, and customer lifetime value without having to log into separate platforms or call in new data all the information is updated automatically in a single ecommerce analytics dashboard.
How to use Cohort Analysis for Marketing purposes?
Cohort analysis becomes especially valuable when applied to marketing performance and retention strategies. When you have identified the cohorts that retain the most, you can find out why and grow successful behaviors!
1. Channel-Level ROAS by Cohort
When you use cohort analysis, you can measure the ROI of each acquisition channel over 6 or 12 months, rather than a 7- or 30-day window. In fact, Google Shopping can have a 3x higher LTV than Meta customers with a lower ROAS, which will change your budget allocation strategy.
2. Campaign Impact Analysis
Was your Q4 loyalty program really effective at boosting retention? Create a group of customers who have signed up for that program and another group who have not, then track their retention over the next 3 months and the following 6 months. This is the definitive test, not open rates, not click-through rates.
3. Winback Campaign Targeting
Cohort data helps identify when customers are most likely to churn, such as during Month 2 or Month 3. You can then create a winback campaign that is triggered at Month 2.5, before they’ve had the chance to churn, but not after.
- Personalize by cohort behavior: Reduce your retention cohorts’ offers, and offer deeper discounts for at-risk cohorts.
- Determine hero products: Identify which first-purchase products generate the highest repeat purchase rates and use them to attract similar customers.
- Optimize email sequences: Run a test for whether a 3-email vs. 5-email welcome flow boosts new cohort Month 1 retention
- Suppress healthy cohorts: Do not spend discount dollars on those that would come back regardless
Tools, Templates & Technology for Cohort Analysis
Choose the correct cohort analysis template or platform, depending on your technical proficiency, data size and the information depth required. Here’s a practical breakdown of the available options:
1. ProactiveAI
Specially designed for ecommerce teams, ProactiveAI provides automated cohort retention grids, channel-level LTV analysis, behavioral segmentation, and real-time alerts without requiring SQL or a data warehouse. Integrates directly with Shopify, WooCommerce, Meta Ads, Google Ads, and more. Includes a ready-to-use cohort analysis template and customizable dashboards your whole team can use.
The platform doesn’t just offer retention reporting, it also allows ecommerce teams to forecast ecommerce sales using historical cohort performance, which helps teams make informed inventory and marketing decisions.
2. Google Analytics 4 (GA4)
Provides basic cohort analysis in the Explore section. Great for Web activity monitoring, but weak in eCommerce retention depth, and not very good at capturing revenue-level cohort data or cross-device repeat purchases.
3. Mixpanel / Amplitude
Robust behavior-based cohorts for SaaS and Apps. Are complex and require extensive setup and data engineering for ecommerce use. Best for product analytics teams with a dedicated data resource.
4. Excel / Google Sheets
A small store with fewer than 5,000 customers can use a cohort analysis template in Google Sheets. While manual and difficult to scale, it provides a useful introduction to the methodology before investing in a dedicated platform.
5. Looker Studio + BigQuery
For enterprise teams that have data engineers. It is highly customizable, but will require SQL skills, data pipeline setup, and maintenance. High ceilings, high floors.
Best Practices for Cohort Retention Analysis
Having the data is only half the battle. Let’s look at how top ecommerce teams are using their cohort data:
- Set a retention benchmark first: Set an industry goal. The average fashion ecommerce retention rate is 20%-30% after Month 1. You know you have a clear goal to close if you’re at 12%.
- Review cohort data monthly, not quarterly: Retention issues can quickly add up. Monthly reviews allow you to get on top of and solve problems before they become structural.
- Segment before you send: Don’t send the same winback campaign to a 5% retention cohort as you would to a 25% retention cohort. The strategies are completely different.
- Use cohorts to measure the impact of your campaign: Test campaigns with cohorts and compare retention rates before and after. Open rates are a luxury, and it’s the customers who stick around who count.
- Link LTV-by-cohort data to your ad platform: Link LTV by cohort data to Google Ads and Meta to create smarter bid strategies. Raise the price for your target audiences with high retention rates.
- Avoid over-discounting their high-LTV cohorts: Your top customers will come back, but without you offering a promo code. Apply cohort data to avoid uncovering unnecessary discounts from already-loyal cohorts.
Conclusion
Cohort analysis is no longer a luxury feature for advanced analytics; it has become a standard ecommerce practice for improving profitability in high-CAC environments. Monitoring group behavior over time moves you away from a reactive ‘firefighting’ approach towards proactive, evidence-based decision making.
This change is one of the reasons cohort analysis is now an integral part of every modern AI business intelligence strategy, providing brands with a better understanding of what drives long-term customer value.
The brands that are succeeding on retention in 2026 are doing more than just marketing—they are marketing smarter.
They use the knowledge and insights gained from cohort data to identify which customers are worth fighting for and when.
They understand which channels create loyal customers, the best onboarding flow to turn one-time shoppers into repeat, and which product types drive long-term relationships.
ProactiveAI is designed with you in mind, automating cohort grids, channel LTV reporting, and native integrations. It helps you move beyond aggregate dashboards and truly understand your customers, taking you from data to decision in hours, not months.
Frequently Asked Questions
What is cohort analysis in ecommerce?
In cohort analysis, the users are divided into groups (cohorts), and their subsequent actions within the cohort are monitored over time. It is useful for ecommerce businesses to understand trends and metrics for retention, repeat purchases, and customer lifetime value.
How do you create a cohort analysis?
Build a cohort analysis, categorize customers into cohorts, choose a performance indicator (e.g., retention, revenue), and monitor it over a period of time. Patterns are easier to see when the data are displayed in a cohort table.
What does cohort retention tell you?
Cohort retention is the percentage of customers in a given cohort who remain engaged or continue to buy over time. It can be used to gauge customer satisfaction and loyalty, spot signs of churn, and assess the performance of customer retention initiatives.
How is cohort analysis different from RFM analysis?
Customer behavior over time is tracked using cohort analysis, and RFM analysis classifies customers based on the three factors of recency, frequency, and monetary value to determine and target high-value customers.
You might also like
Handpicked articles for your reading list.

Get the latest insights on Conversational AI
Stay ahead of the curve with weekly updates on data analytics, AI trends, and eCommerce growth strategies delivered straight to your inbox.
Join 5,000+ industry leaders. Zero spam, just pure insights.