
 SparxIT
 SPXCommerce
 What's Your A


eCommerce
Marketing
Customer Churn Rate: Formula, Benchmarks & How to Reduce It
-
Varun Kumar
- May 29, 2026
- 8 mins read
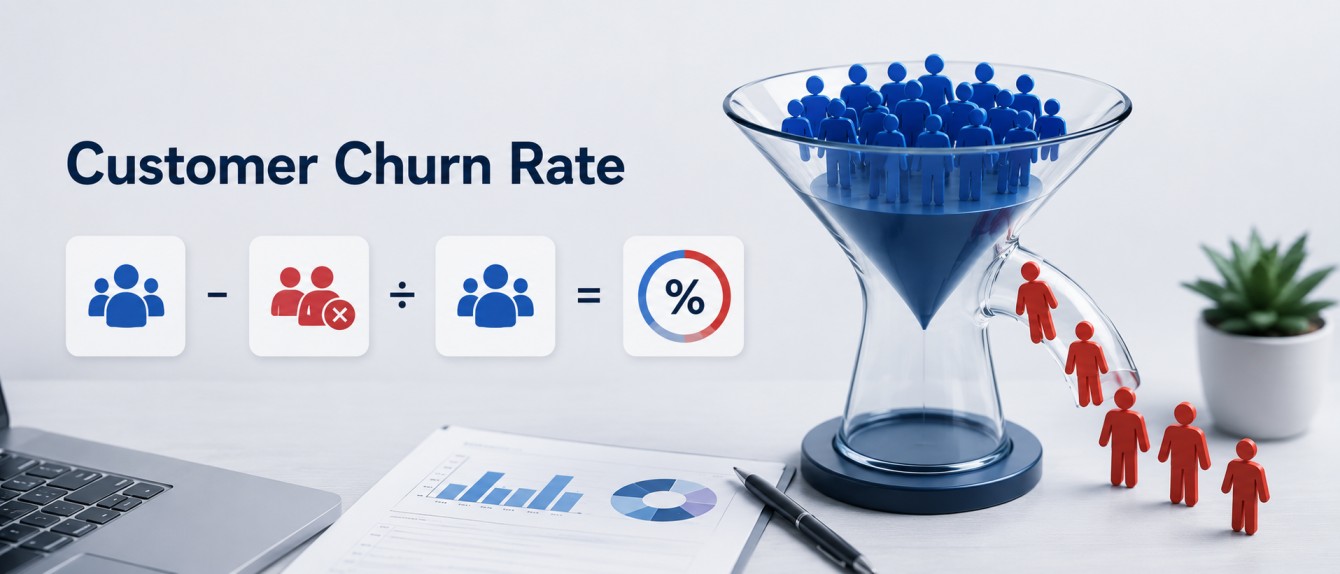
Your marketing is on fire! You have a team of salespeople who are closing deals. However, there’s a hidden problem in the background: customers are leaving. They are not sending cancellation emails or complaints. They just don’t renew, they don’t buy, they don’t show up. And, if you don’t track your customer loss rate in real time, you might not realize it until it becomes an issue you can’t ignore.
It is one of the most painful truths in today’s business: It takes five times as much money to attract a new customer as it does to keep an existing one, but most companies invest most of their budget into attracting new customers. A powerful way to grow your business is to understand and reduce customer churn, particularly for SaaS providers, eCommerce businesses, and subscription-based companies.
Here, you’ll learn the complete breakdown of the customer churn rate, including what it means, how to calculate it, where it’s supposed to be in your industry, and the strategies that have proven to work to reduce the churn rate. Oh, and we’ll also share with you how you can gain actionable insights from raw churn data with the help of ProactiveAI.
What Is Customer Churn?
Churn rate, also known as customer attrition rate, measures the percentage of customers who leave a business over a given time frame. It gives companies a sense of customer satisfaction and loyalty, and can indicate what changes in a company’s bottom line are possible.
In particular, churn is critical for SaaS companies, subscription-based businesses, telecom companies, and e-commerce sites, where recurring revenue is the lifeblood of the business. Churn is one of those metrics that can affect annual recurring revenue by millions of dollars with a single percentage-point change.
Churn Rate Formula & How to Calculate Churn Rate?
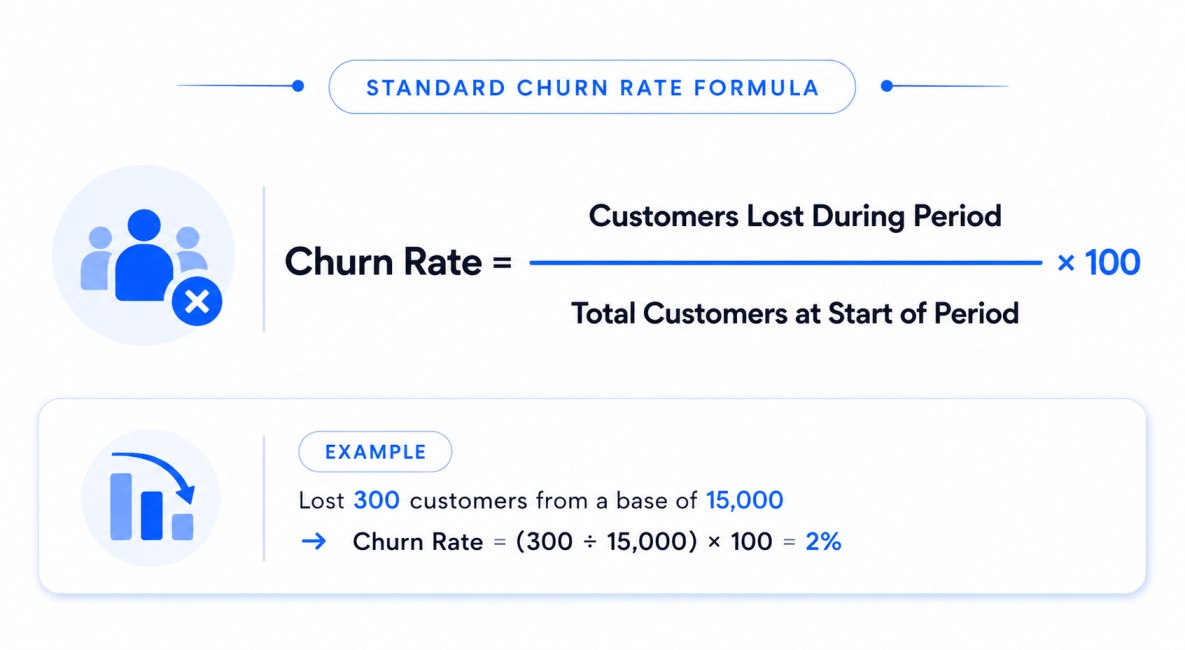
The churn rate formula is simple, but how you apply it changes the insights you get.
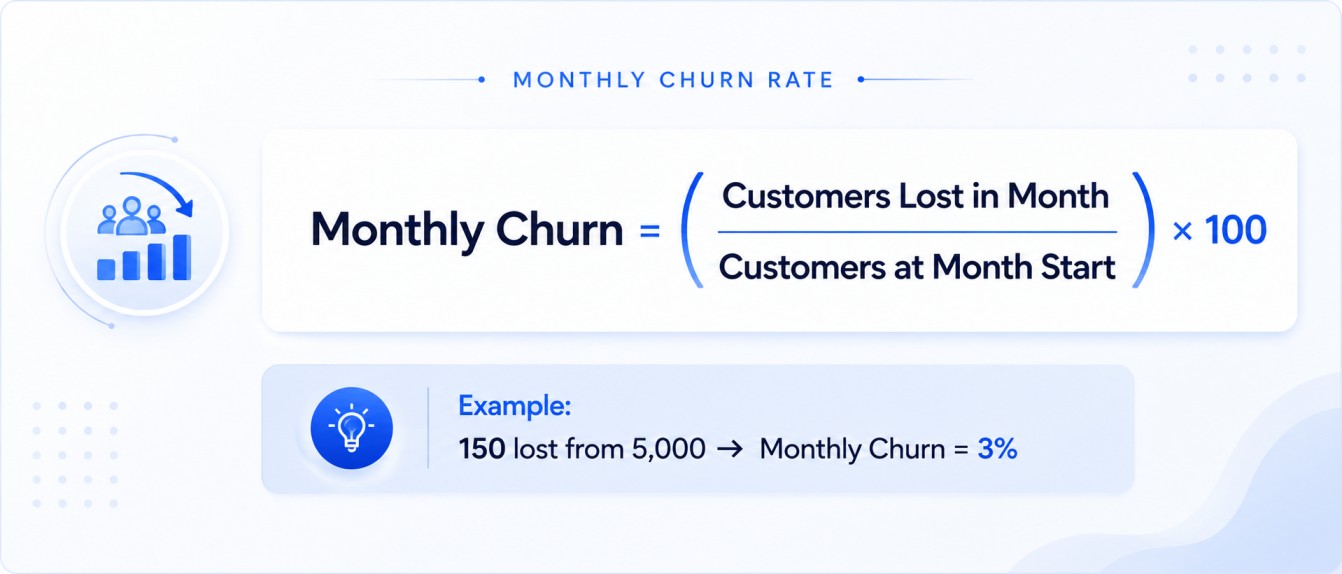
Monthly Churn Rate
If churn rate is tracked using monthly start/end, then use the same formula. A monthly view provides quicker feedback loops, particularly with retention campaigns.
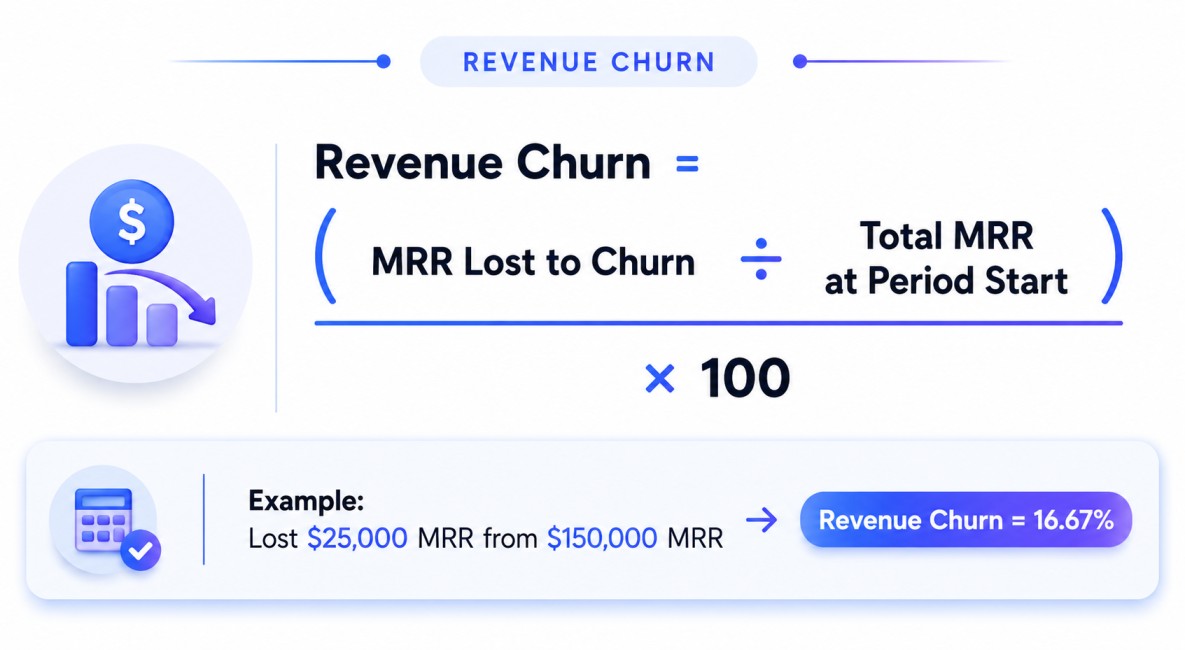
Revenue Churn Rate
In addition to customer numbers, the revenue churn rate shows how much revenue you are losing, not just how many customers. This is particularly important when there are a variety of plan sizes.
What are The Types of Customer Churn?
Not all churn is the same. Understanding what’s causing the people to leave is the first step in solving the problem. The two main types are:
Voluntary Churn
It is the most practical type. The reasons customers leave include a poor customer experience, dissatisfaction with the product’s cost, and simply finding another product they like better. Product-market fit and customer success can be directly indicated through voluntary churn.
Involuntary Churn
This occurs when customers are terminated from the game without actively wishing to end their association (due to failed payment processing, expired credit card, service disruptions, etc.). Up to 20-40% of churn can be involuntary, but it is easily recovered if the proper systems are in place.
| Voluntary Churn Signals | Involuntary Churn Signals |
| Cancelled subscriptions | Payment failures |
| Switch to competitor | Expired cards/billing errors |
| Price objections | Technical issues at renewal |
| Poor onboarding experience | Service downtime at key moments |
| Lack of product value perceived | Subscription plan removal |
Average Churn Rate by Industry
The “good” churn rate is largely dependent on your business. A churn rate considered healthy in one industry may be harmful in another. Context is everything.
| Industry | Avg. Annual Churn Rate | Avg. Monthly Churn Rate | Difficulty in Retaining |
| Enterprise SaaS | 5–7% | ~0.5% | Low |
| SMB SaaS | 10–15% | ~1.2% | Medium |
| E-Commerce (Subscription) | 20–30% | ~2–3% | Medium |
| Digital Media / Streaming | 30–50% | ~4–5% | High |
| Telecom | 20–38% | ~2.5–3.5% | High |
| Financial Services | 10–25% | ~1.5–2% | Medium |
| Healthcare / Wellness | 5–10% | ~0.7% | Low |
| Retail (General) | 25–45% | ~3–5% | High |
Industry Context
Recurly research suggests that the typical churn rate for a subscription business is around 4%, with 3% voluntary and 1% involuntary. Digital entertainment rates are significantly higher, and software and professional services are lower.
Churn Rate vs Retention Rate: What’s the difference?
These two metrics measure opposite outcomes. They’re like the two sides of a coin, and one shows you how many customers you are losing, the other shows you how many you are keeping.
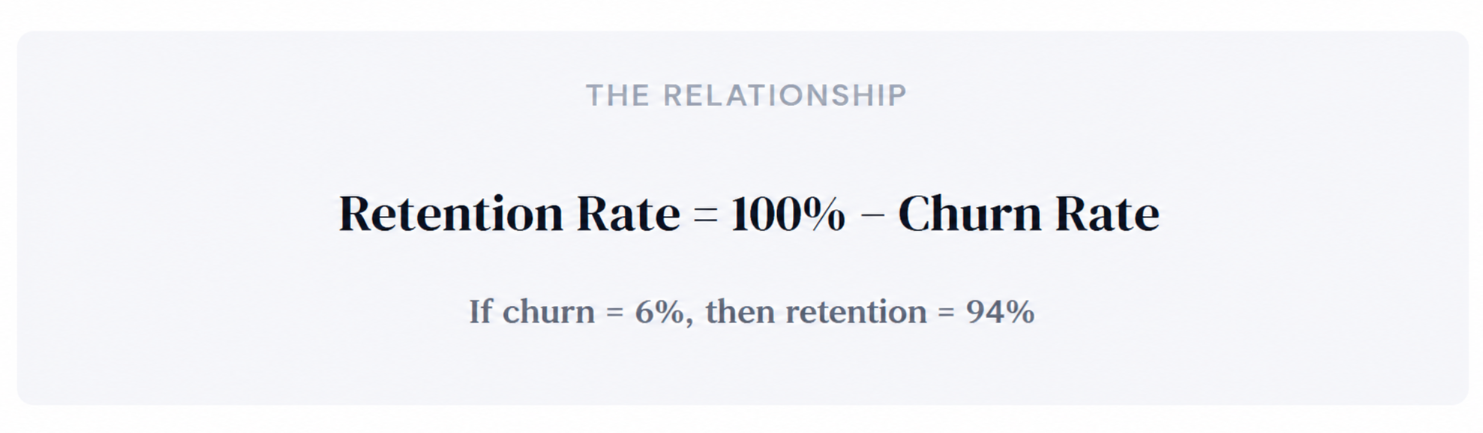
The retention rate is frequently used in presentations to stakeholders and in investor decks, since a high percentage is easier to motivate with. But for campaigns where you’re testing A/B on retention efforts, it’s important to track both of these together.
| Metric | What It Measures | Best Used For |
| Churn Rate | The percentage of customers who drop out during a time period | Diagnosing problems, risk alerts |
| Retention Rate | % of customers retained during a specific time interval | Measuring the success of loyalty programs |
| Revenue Churn | Revenue lost due to churned accounts | Forecasting financial performance and investor reporting |
| Net Revenue Retention | Revenue retained + expansion from existing customers | SaaS growth benchmarking |
Churn Rate in E-Commerce: A Special Case
In ecommerce, the concept of churn rate is similar to, yet distinct from, that of a subscription model. In ecommerce, churn usually refers to customers who stop making purchases over time.
A commonly cited metric closely related to repurchase rate is the percentage of customers who repurchase the same item (also called the “return rate”). Daasity says improving repurchase rate is one of the biggest ROI levers in eCommerce because a second purchase is a good indicator that a user will return for future business.
How E-Commerce Brands Define a Churned Customer?
- No purchase for the last 90, 180, or 365 days (based on the product purchase cycle)
- After a period of inactivity, the email address is unsubscribed.
- Subscription box canceled or skipped streak past threshold.
- The deletion of an account and/or explicit opt-out.
Root Causes of High Customer Churn
What you don’t know you can’t fix. The most frequent reasons for increased churn have something in common: they’re almost always identifiable before a customer leaves if you’re looking for them.
1. Poor Onboarding Experience
When customers fail to experience value within the first 7–14 days, this dramatically increases their likelihood of churning. This is caused by setting up difficulties, guidance issues, or feature overload.
2. Unresolved Customer Service Issues
One poor support experience can damage customer trust. Research has repeatedly shown that customers who are effectively handled when they have problems are more loyal than those who have never had any problems.
3. Pricing & Value Misalignment
Customers churn when they believe the cost doesn’t justify the value, particularly at renewal time. This is particularly true with SaaS, where usage is low and billing is high.
4. Competitor Offers
Even if they are satisfied, a better feature set, lower price, or better UX from a competitor can draw customers away. The best defense is proactively engaging.
5. Lack of Personalization & Engagement
Customers who feel treated like a number, don’t receive any proactive outreach, or receive general emails, disengage quickly. Customers now expect personalized experiences.
6. Low Product Adoption
If your customer is only using some of your product’s features, they have yet to see its value. One of the best initial indicators of churn is low feature adoption.
Proven Strategies on How to Reduce Customer Churn?
Reducing customer churn isn’t a single initiative, and it’s a discipline that spans customer success, product, marketing, and data analytics. Here are the highest-impact strategies backed by research and real-world execution:
1. Build a Predictive Churn Model
The best action you can take is to find out who is at risk of leaving before they do. Behavioral metrics, such as login frequency, feature usage, the number of support tickets opened, and NPS scores, can be used to develop a churn propensity score that identifies accounts for proactive engagement efforts.
This is where modern analytics platforms can provide immediate ROI through AI-driven customer segmentation and predictive analytics dashboards, helping deliver measurable returns.
2. Streamline your onboarding process
Trace your customer’s journey from sign-up to the first value. Reduce friction, automate sign-ins, and ensure the best features are at the top of the list. Think about introducing interactive product tours, onboarding emails based on behavior, and a specific touchpoint from the customer success team at day 7 and day 30.
3. Implement a Customer Health Score
A customer health score combines several engagement metrics into a single score. Green = prolific, Yellow = at risk, Red = likely churn. Your customer success team should check red accounts daily and yellow accounts weekly. Create and visualize custom health score frameworks for all your customers in real time with a self-service dashboard builder.
4. Launch a Win Back Campaign
Many churned customers can still be re-engaged. A timely email win-back campaign can win back an additional 10-20% of lost customers, especially if it is personalized, provides genuine value, or offers a special deal. Divide your top customers into segments and tailor your message to the reasons they churned.
5. Gather & Act on Exit Feedback
All customers who leave are a tremendous source of data. Integrate an easy-to-implement exit survey into your offboarding process. Most importantly, close the loop: classify feedback monthly, share it with product and leadership, and monitor whether things are being addressed.
6. Create Loyalty Incentives That Drive Stickiness
Long-term contracts, annual price discounts, and loyalty bonuses all have a real impact on reducing churn. Not by burying the cancel button, the answer was to provide customers with good reasons to remain. A customer who has invested in (time, data, integrations) is exponentially more difficult to lose than one who simply signed up.
7. Fix Involuntary Churn with Smart Billing Recovery
Enable dunning management automatic retry logic for failed payments, pre-expiry credit card update reminders, and in-app notifications for payment problems. These systems can help subscription businesses recover 30-40% of customers who have failed payments.
Why ProactiveAI Is Your Churn-Reduction Superpower?
One critical factor in reducing churn is having the right data at the right time in the right hands. ProactiveAI is an innovative Business Intelligence platform designed for teams that want to turn raw customer data into actionable insights without delay.
We provide your customer success team with a real-time health score and give your marketing team behavior-based automated re-engagement campaigns. Your leadership team also gains clear visibility into revenue churn, enabling confident, data-driven decisions.
Regardless of whether you’re monitoring the monthly churn rate for a software-as-a-service product, the repurchase rate for an e-commerce company, or the subscriber retention for a media platform, ProactiveAI flexible analytics framework adapts to different business models and customer retention needs.
Conclusion
Customer churn rate is a critical business performance metric, and it’s a vital sign for your business. When the churn rate increases, there is something wrong with your customer experience, product, or pricing. When the churn rate slows, it means your retention efforts are beginning to pay off with long-term growth.
The way forward is simple: measure it consistently, compare it to your industry, find root causes, and implement interventions. The companies that are winning in 2026 don’t necessarily have the highest number of customers; they’re the ones who’re retaining them!
Begin with the formula. Track churn consistently and address retention gaps early. And when you require a strong analytics partner to do it on a scale larger than a single person, ProactiveAI was built to do just that.
Your top customers are the ones you should fight for. The information you need to help them is already in your hands, and you simply need the right tools to see it.
Frequently Asked Questions
What is the customer churn rate?
Churn rate is the percentage of customers who cancel their product or service over a given period. It measures the number of customers a business loses over time.
How do you calculate churn rate?
Churn rate is calculated using this formula:
Churn Rate (%) = (Customers lost during a period ÷ Total customers at the start of the period) × 100
Example:
If you start the month with 1,000 customers and lose 50 → churn rate = (50/1000) × 100 = 5%
What is a good churn rate for ecommerce?
For ecommerce businesses, a “good” churn rate varies by model, but generally:
- Many ecommerce brands will find 5%-10% monthly churn to be acceptable.
- Less than 5% per month is good (particularly for subscription ecommerce)
- When it comes to ecommerce, a one-time purchase does not necessarily mean the same definition as churn as in SaaS.
Retention quality and repeat purchase rate often matter more than raw churn in ecommerce.
How is churn rate related to retention rate?
Churn rate and retention rate are directly connected:
- Retention Rate = 100% − Churn Rate
So if:
- Churn = 8% → Retention = 92%
They measure opposite outcomes:
- Churn = customers leaving
- Retention = customers staying
What strategies reduce customer churn most effectively?
The most effective churn reduction strategies include:
- Improve onboarding experience → helps users reach value quickly
- Better customer support → resolves issues before users leave
- Personalization → tailored recommendations and messaging
- Pricing optimization → reduce friction or offer flexible plans
- Proactive engagement → emails, reminders, and lifecycle messaging
- Fix product value gaps → ensure users achieve desired outcomes
- Reduce payment failures → retry systems, card update reminders
- Loyalty & retention programs → rewards for repeat usage
You might also like
Handpicked articles for your reading list.

Get the latest insights on Conversational AI
Stay ahead of the curve with weekly updates on data analytics, AI trends, and eCommerce growth strategies delivered straight to your inbox.
Join 5,000+ industry leaders. Zero spam, just pure insights.