


eCommerce
Marketing
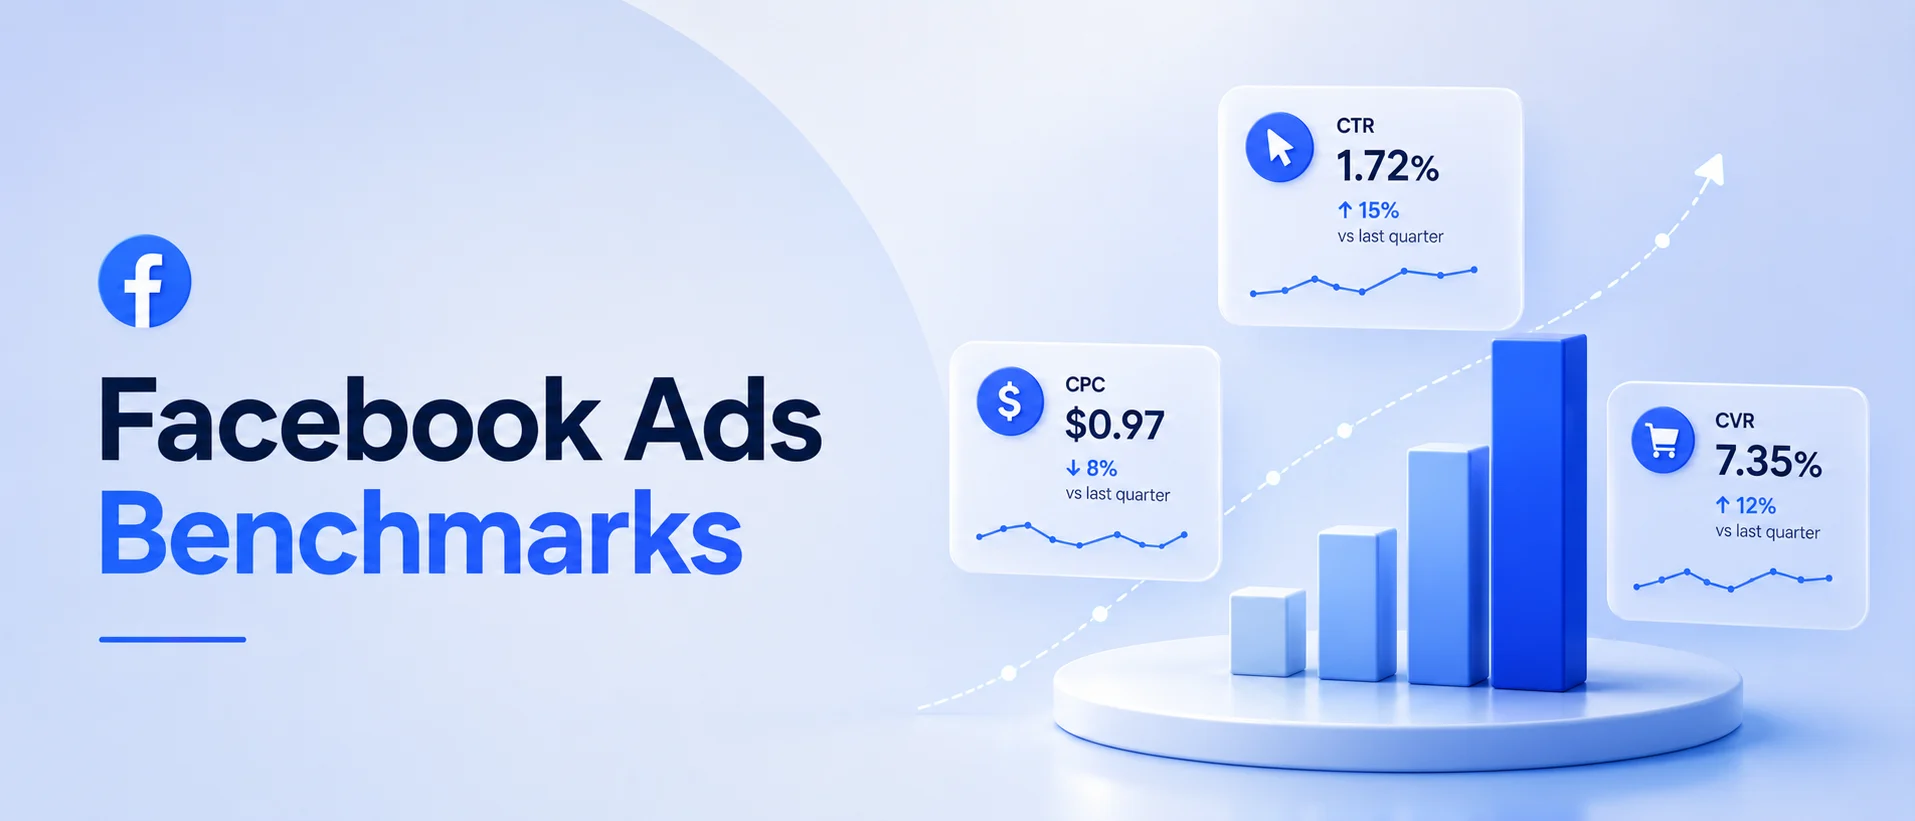
Facebook Ads Benchmarks by Industry (2026 Updated Data)
-
Varun Kumar
- Jun 04, 2026
- 9 mins read
You’ve established the budget, launched the campaign, and are getting some numbers rolling, but you don’t know whether you’re in celebration mode or emergency mode. If there are no industry standards, there is no point in having any metric. This is the biggest pain for thousands of advertisers using Meta ads today.
You’ve seen the cost per click on your Facebook Ads Manager and thought: “Is my CPC really that bad, or is that just the way the market is these days? The issue is not a lack of data. It’s a lack of context. The 2026 Facebook ads benchmarks are exactly what you need for context.
Today, a growing number of marketing teams are leveraging AI in business intelligence to transform raw Meta Ads data into actionable optimization insights, faster than ever before.
This guide can help you compare your own performance against the latest benchmarks on a vertical-by-vertical basis and give you insight into which areas you could be missing out on revenue. It will also help you implement your campaigns with confidence and accuracy.
Why Facebook Ads Benchmarks Matter More Than Ever in 2026
Meta’s advertising ecosystem has completely evolved. The landscape has changed dramatically, from Apple’s ATT framework, which has compromised signal fidelity, to Meta’s relentless focus on AI for Advantage+ placements, to increased auction competition in just about every vertical. Benchmarks provide a reliable framework for evaluating campaign performance.
Here’s what they’re worth:
- Spot underperformance early: If a CPA is 40% higher than the industry standard, that’s a warning sign to investigate before increasing spend.
- Justify budgets confidently: A 2.1% CTR alone isn’t enough to make a statement; it’s the story of the industry average of 1.4% that makes the difference.
- Prioritize optimization correctly: If you have a competitive CPM, then you have a post-click issue, not a reach issue.
- Set realistic KPIs: Benchmarks will keep you from setting goals you’ll be embarrassed to miss or ones that are unrealistic.
The Core Meta Ad Metrics You Need to Track
But before getting into the numbers, it’s important to first agree on the actual measure for each one and why it’s relevant to diagnosing the health of your campaign.
|
Metric |
What It Measures |
Why It Matters |
| CTR (Click-Through Rate) | % of impressions that convert into clicks | Indicates audience relevance and creative effectiveness |
| CPC (Cost Per Click) | The amount charged for each click | Measures traffic efficiency |
| CPM (Cost per 1,000 Impressions) | Cost to achieve 1,000 impressions | Reflects the competitiveness of ad auctions in your vertical |
| CVR (Conversion Rate) | % of clicks that convert | Identifies the effectiveness of landing pages and offers |
| CPA (Cost Per Acquisition) | Cost required to acquire a customer or lead | Measures the ultimate efficiency of lead generation |
| ROAS (Return on Ad Spend) | Revenue generated per $1 spent on ads | Primary ROI indicator for ecommerce campaigns |
It’s as crucial to know how these metrics relate as it is to know the numbers. If you have a high CTR but low CVR, it is most likely a landing page issue, not a creative issue. If traffic is increasing but ROAS isn’t, then CPM is increasing without a corresponding increase in returns.
Overall Facebook Ads Benchmarks (2026 Averages)
These are cross-industry averages for 2025-2026, based on data from millions of active Meta campaigns. These are general cross-industry averages that you can use as a starting point for each campaign.
|
Metric |
Value |
Scope / Notes |
| Avg. CTR | 1.51% | All placements, all objectives |
| Avg. CPC | $1.72 | Traffic campaigns |
| Avg. CPM | $13.48 | Feed placements |
| Avg. CVR | 9.2% | Click to convert |
| Avg. CPA | $27.40 | All lead gen campaigns |
| Avg. ROAS | 3.5× | Ecommerce average |
Our Insight
These averages do not reflect the significant differences among industries. A 1.51% CTR is extremely good for B2B SaaS but not so good for fast-fashion ecommerce. Benchmarking is always done against your vertical, and that is what an AI automated benchmarking dashboard does in real time.
Facebook Advertising Benchmarks by Industry (Full 2026 Data)
The table below consolidates all of the above to provide you with the most complete picture of Facebook ads benchmarks for 2026 across the industry. Analyze performance in CTR, CPC, CPM, CPA, and ROAS columns, and compare these metrics with peers in your vertical.
| Industry | Avg. CTR | Avg. CPC | Avg. CPM | Avg. CPA | Avg. ROAS |
| Ecommerce (Fashion) | 1.72% | $0.98 | $11.20 | $18.40 | 4.8× |
| Ecommerce (Home & Garden) | 1.44% | $1.12 | $12.80 | $21.60 | 4.1× |
| Beauty & Personal Care | 1.65% | $1.05 | $11.90 | $19.80 | 5.2× |
| Food & Beverage | 1.38% | $0.88 | $10.60 | $16.20 | 3.8× |
| Health & Wellness | 1.29% | $1.64 | $15.80 | $31.40 | 3.2× |
| Finance & Insurance | 0.72% | $4.10 | $22.40 | $68.20 | 2.1× |
| Legal Services | 0.65% | $4.80 | $24.10 | $74.50 | – |
| Real Estate | 0.98% | $2.60 | $17.40 | $42.80 | – |
| Education & eLearning | 1.18% | $1.88 | $14.20 | $34.60 | 2.8× |
| SaaS / B2B Tech | 0.61% | $3.42 | $18.60 | $58.30 | 2.4× |
| Travel & Hospitality | 1.52% | $1.30 | $13.40 | $26.80 | 4.4× |
| Non-Profit | 1.88% | $0.46 | $10.20 | $14.40 | – |
| Automotive | 0.87% | $2.24 | $16.80 | $46.20 | – |
| Fitness & Sports | 1.41% | $1.32 | $12.60 | $24.10 | 3.6× |
| Retail (General) | 1.35% | $1.18 | $13.10 | $23.80 | 3.9× |
Facebook Ads CPM by Industry: What’s Driving Costs Up in 2026?
The Facebook ads average CPM has climbed to $13.48 across all industries, up from roughly $11.20 in 2024. Three forces are driving this:
- Increased advertiser competition: More businesses shifted their ad spend from Google to Meta, driving up competition across nearly every vertical.
- Meta’s AI-powered delivery: Advantage+ campaigns are becoming increasingly competitive, bidding up to snag higher-quality audiences.
- Reduced signal fidelity post-iOS 17: When the data available for targeting is less accurate, Meta’s system adjusts by paying more for conversions in a larger pool.
CPMs in legal and financial sectors are at their highest ($22-$24) because they have the heaviest compliance-constrained competition. Non-profit and food/beverage advertisers pay between $10 and $11, which is the lowest CPM, in part because they have fewer restrictions on their creative and targeting.
Facebook Ads CTR Benchmark: What a “Good” Click-Through Rate Looks Like
The Facebook ads CTR benchmark is mostly 1.51% across all industries for feed placements in 2026. However, averages can be misleading. Here are the factors that really cause the variation in CTR:
CTR by Format
- Video ads (Reels/Stories): 1.8%–2.4% average and remain among the highest-performing ad formats in 2026.
- Single image (Feed): 1.2%–1.7% average
- Carousel: 1.4%–2.0% is good for ecommerce product showcases
- Collection: 1.1%–1.6% average
- Text-heavy / Whitepaper lead gen (B2B): 0.5%–0.9% average
When your CTR falls short of your industry benchmark, it will most likely be due to one of three things: poor hook in the first 3 seconds of video, a poor headline that is not aligned with the audience, or creative fatigue.
Facebook Ads CPA Benchmarks: How Much Should a Conversion Cost?
Perhaps the most actionable metric in your reporting stack is CPA because it directly connects ad spend to business outcomes. The cross-industry average CPA is $27.40, and without context, it doesn’t have much meaning.
What causes variations in CPA?
CPA is the result of your CPC and your post-click conversion rate. Expensive clicks in industries such as finance and legal, combined with poor landing page conversion rates, can lead to a high CPA. The right optimization strategy depends on the root cause:
- High CPC + decent CVR: The issue is the auction, think about using advantage + audience and/or wider targeting or moving to video to boost relevance scores.
- Low CPC + low CVR: Post-click issues and focus on landing page A/B testing, clarity, and speed.
- High CPC + low CVR: The issue is selecting the right audience, messaging, and full-funnel approach.
B2B and SaaS advertisers often accept CPAs of $50–$80 because lifetime customer value justifies it. Ecommerce brands with thin margins may need to keep CPA under $20 to stay profitable. Always benchmark CPA against your specific LTV, not just the industry average.
Facebook Ads ROAS Benchmark: What Return Should You Expect?
In general, the Facebook ads ROAS benchmark is 3.5x in the ecommerce industries in 2026, meaning businesses generate $3.50 in revenue for every $1 invested in ads on Facebook. However, there are some interesting subtleties to this number:
| ROAS Level | What It Signals | Likely Action |
| Below 2× | For most margin structures, the campaign will probably not be profitable | Pause, audit, and restructure |
| 2× – 3× | Low, only viable for low-margin or strong LTV businesses | Optimize creatives and targeting |
| 3× – 5× | Healthy, equal to or better than industry averages across many verticals | Scale wisely with creative refreshes |
| 5× – 8× | Fairly strong, indicates strong creative-audience alignment | Scale aggressively |
| Above 8× | Outstanding, often driven by highly optimized retargeting or viral creatives | Protect and investigate the winning formula |
Meta’s Advantage+ Shopping campaigns are delivering higher ROAS than manual campaign structures for many ecommerce brands. Around 70% of advertisers that have adopted Advantage+ report improved performance. Its success comes from Meta’s algorithm having greater freedom to target high-intent audiences and optimize across the entire sales funnel.
More and more growth teams are using this data and predictive analytics to anticipate sales profitability trends before increasing the campaign budget.
How ProactiveAI Helps You Beat the Benchmark, Not Just Read It
It’s good to know that your CPA is 35% higher than the industry average. However, when it comes to results, it’s the ability to understand what’s happening and receive automated suggestions on how to improve that makes the difference. It’s at this point that ProactiveAI differentiates itself.
We provide a live benchmark comparison that lets you instantly compare your CTR, CPM, CPA, and ROAS with the industry in real time, and updates daily for even more accurate results.
Our creative performance scoring lets you know which ad creatives are performing well and catch any performance fatigue early, before it gets worse. Cross-channel attribution helps connect Meta Ads performance to verified purchases and pipeline outcomes.
The funnel diagnostics show you exactly how your performance is dropping, from impressions to clicks to conversions. And with our automated reporting dashboard, you can replace manual spreadsheets with intelligent reporting systems your team and clients can confidently trust.
Best Practices to Improve Your Facebook Ads Performance in 2026
Winning on Facebook Ads in 2026 requires more than increasing the budget. It demands smarter targeting, stronger creative, and better data signals. Brands that continuously test, optimize, and align campaigns with customer intent will achieve stronger ROAS and long-term growth.
1. Embrace Creative Diversification
For each ad set, try out 3-5 different creatives: at least 1 under 15-second video, 1 static image, and 1 UGC style. Meta’s algorithm requires diversity to optimize. Limited creative diversity can restrict campaign performance.
2. Let Meta’s AI Do the Heavy Lifting on Targeting
In direct response, there is no year in which Advantage+ Audience isn’t outperforming manual interest targeting. Audience targeting strategies that performed well in 2021–2022 may now limit Meta’s ability to identify high-value customers at scale.
3. Fix the Post-Click Experience First
A slow, generic, or mismatched landing page cannot be overcome by any optimization strategy. Your landing page should replicate your ad’s message, offer, and feel. Meta’s mobile traffic accounts for more than 85% of the total. For mobile, page load speed is non-negotiable and must be less than 2.5 seconds.
4. Monitor Frequency Alongside CPM
At frequencies above 3.5-4.0 with cold audiences, CTR usually drops significantly. Use frequency as a leading indicator and refresh creatives before performance begins to decline.
5. Use a Dedicated Analytics Platform, Not Just Ads Manager
Conversions are attributed in ways that can greatly overestimate ROAS, especially via view-through attribution windows, in Meta Ads Manager. When you bring your ad data to a neutral system like ProactiveAI, you get a true picture of your ads’ actual performance, which can be essential when allocating your budget.
For brands that opt for self-service analytics platforms, this means identifying performance problems sooner than those that rely on manual reporting or engineering.
Conclusion
Facebook ads benchmarks represent your reality check, or the external standard that makes a sea of numbers into actionable insight. If you’ve been trying to compare CPM across industries, tracking CPA against the vertical CPA benchmark, or wondering why your ROAS is not as high as everyone else’s, you’ll have the context you’ve been missing in this guide.
In 2026, advertisers who do this build solid creatives, use smart automation, and have clear analytics will be rewarded with a landscape that is more favorable. ProactiveAI is designed specifically to bridge this gap: connecting your Meta ad data to measurable business results, where every optimization decision is based on data, not gut.
Frequently Asked Questions
What is the average CPA on Facebook ads?
Facebook Ads CPA averages $27.40 for lead-generation ads, but can vary by industry, targeting quality, funnel optimization, and campaign goal. Acquisition costs vary significantly by industry and are often higher in high-ticket and highly competitive sectors.
What is a good ROAS for Facebook ads?
Most marketers believe that a good Facebook Ads ROAS is between 3:1 and 4:1, which translates to $3 to $4 per dollar spent. Ecommerce brands with very high optimization are looking for 5 times or more.
What is the average CPM on Meta in 2026?
In 2026, the average CPM for Meta’s platforms on feed placements is around $13.48. CPM rates vary based on competition, seasonality, ad quality, industry demand, and the audience’s campaign goals.
Which industry has the best Facebook ad performance?
These industries typically deliver strong Facebook Ads performance, with the ecommerce, beauty, fitness, and online education industries offering the best environment for creatives to be visually appealing. There is great demand within the industry, and the marketing funnels are scalable and metric-driven.
You might also like
Handpicked articles for your reading list.

Get the latest insights on Conversational AI
Stay ahead of the curve with weekly updates on data analytics, AI trends, and eCommerce growth strategies delivered straight to your inbox.
Join 5,000+ industry leaders. Zero spam, just pure insights.