


AI & Analytics
eCommerce
Contribution Margin in eCommerce: What It Is, How to Calculate It, and Why It Matters More Than Revenue
-
Vikash Sharma
- Jun 19, 2026
- 11 mins read
Many eCommerce brands track revenue growth, but far fewer understand how much profit that growth actually generates. When sales are up, so are advertising costs, free shipping deals, payment processing fees, fulfillment costs, and product returns, all of which can slowly eat away at profits. This can create the illusion of growth while overall profitability continues to decline.
This is where contribution margin in eCommerce comes in handy. Unlike sales focus, contribution margin provides a picture of the real profit of products, orders, campaigns, and sales channels by excluding all variable costs from revenue. It helps brands identify profit drivers, uncover hidden margin leaks, and align marketing and finance teams around sustainable growth rather than vanity metrics.
In this guide, you will learn about contribution margin, how it is calculated accurately, its difference from gross margin, and how top brands use contribution margin to fine-tune their pricing strategies, marketing budgets, product strategies, and profitability of their business.
What is Contribution Margin in eCommerce?
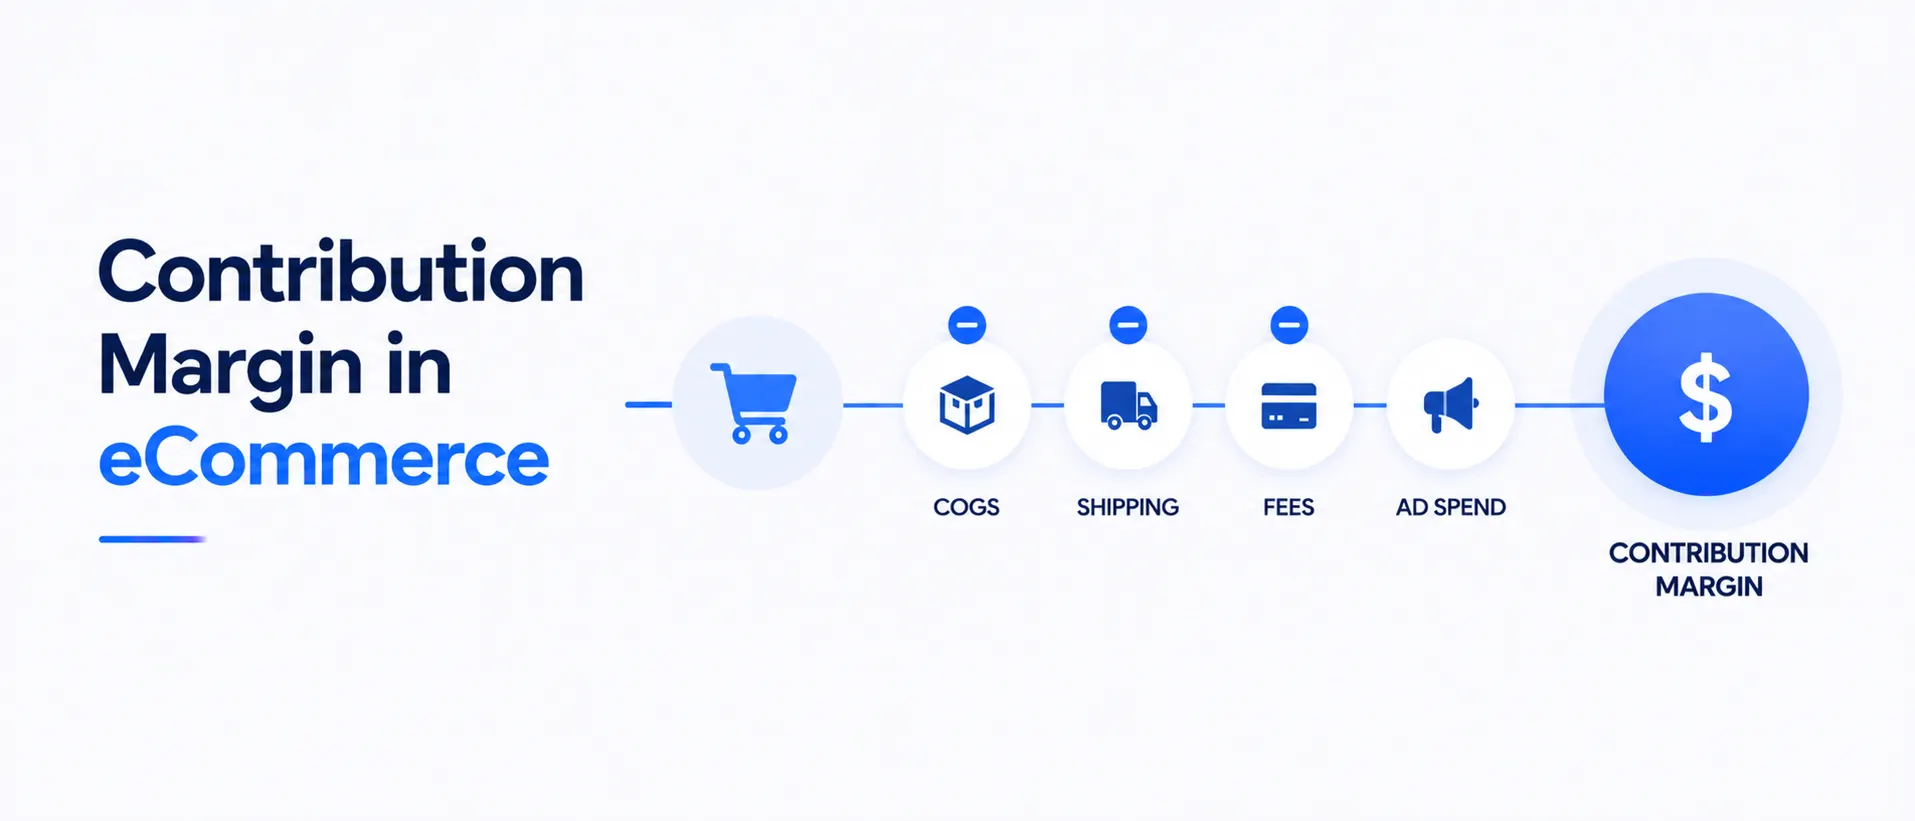
In eCommerce, contribution margin is the profit left after deducting all variable expenses from a product or sale, including product costs, shipping charges, packing materials, payment gateway fees, discounts, returns, and marketing costs. Unlike fixed costs (rent, salaries, or software subscriptions), these costs fluctuate with the number of orders.
This metric indicates the share of fixed cost and profit each order, product, or sales channel contributes to the overall business. Revenue also indicates sales growth, but the contribution margin shows whether that growth is profitable and is one of the most significant measures for assessing eCommerce performance and sustainability.
The Contribution Margin Formula for eCommerce
Although the inputs need to be meticulously tracked, the formula that ecommerce brands should use is simple in structure:
Contribution Margin = Net Revenue − Total Variable Costs
Net Revenue = Sales − Discounts − Refunds − Chargebacks
Total variable Costs = COGS + Shipping + Payment Fees + Marketing Costs + Return Costs
A second, equally useful figure is the contribution margin ratio (in percentage):
Contribution Margin Ratio = (Contribution Margin ÷ Net Revenue) × 100
This ratio indicates to a brand the percentage of each rupee or dollar generated that actually goes towards paying off fixed costs and creating profit.
A Worked Example
Let’s take an example of a mid-sized DTC skin care brand that made ₹10,00,000 in gross sales in a month, of which ₹80,000 were discounts and ₹40,000 were returns, meaning the brand’s net sales for the month were ₹8,80,000.
| Cost Category | Amount (₹) |
| COGS | 2,80,000 |
| Shipping and fulfillment | 1,20,000 |
| Payment processing fees | 35,000 |
| Marketing spend | 1,90,000 |
| Impact of returns and discounts | 1,20,000 |
| Total Variable Costs | 7,45,000 |
Contribution Margin = ₹8,80,000 − ₹7,45,000 = ₹1,35,000
Contribution Margin Ratio = (1,35,000 ÷ 8,80,000) × 100 ≈ 15.3%
15.3% is the indicator. It explains that if the leaders are making a profit of Rs. 1 at a rupee of sales, then fixed costs and profit absorb about 15 paise, and selling costs absorb 85 paise.
Gross Margin vs. Contribution Margin
Gross margin measures revenue after product costs (COGS). Contribution margin goes further by subtracting all variable costs, including fulfillment, payment processing, and marketing expenses, to reveal true profitability.
|
Aspect |
Gross Margin |
Contribution Margin |
| Formula | Revenue – COGS | Revenue – All Variable Costs |
| Includes marketing spend | No | Yes |
| Includes shipping and fulfillment | No | Yes |
| Includes payment processing fees | No | Yes |
| Best used for | Product costing, vendor negotiation | Profitability of channels, SKUs, or campaigns |
| Takes into account the cash effects of a sale | Partially | Fully |
A brand can have a high gross margin of 60%, but a very low CM after accounting for ads and shipping. This is why both are important: gross margin indicates product pricing strength, and contribution margin indicates true profitability per sale.
Why Revenue Growth Can Hide Shrinking Margins?
It’s common for eCommerce brands to report higher revenue while experiencing declining profitability. It is often the case that the costs of goods and services increase faster than sales.
As the cheap audience is saturated, acquisition costs rise as customers become more costly to acquire. Meanwhile, brands rely on deeper discounts to sustain growth, resulting in lower profit per order.
The more orders you process, the higher your returns, chargebacks, and customer service expenses will be. Revenue can present a positive picture, but true profitability is reflected in the contribution margin.
Key Components of Variable Cost in eCommerce
To accurately measure contribution margin, brands must understand the individual cost drivers that make up their variable expenses. Because these costs fluctuate with sales volume, each should be tracked and monitored separately.
- Cost of Goods Sold (COGS): Raw materials, manufacturing, and packaging costs directly related to the product itself.
- Shipping and Fulfillment: These include carrier fees, 3PL warehouse charges, and last-mile delivery costs, all of which can vary with fuel prices and carrier negotiations.
- Payment Processing Fees: Fees deducted from Shopify Payments, Razorpay, PayPal, etc., which are generally a percentage of every sale.
- Marketing and Advertising Spend: Costs of performance marketing on Meta, Google, and other channels attributed to the orders they brought.
- Discounts and Promotions: Revenue lost when a customer uses a discount code, participates in a sitewide sale, or applies a loyalty reward.
- Returns & Refunds: Expenses associated with inventory returned for processing, resale, or write-off, plus refund shipping.
When brands don’t measure these categories regularly, they often find their contribution margin appears better than it really is, leading them to make overly optimistic scaling decisions.
Contribution Margin Per Order: Why Granularity Matters
An overall contribution margin provides a useful health check, but it often hides important details. Analyzing contribution margin at the order level provides more actionable insights because it reveals the profitability of each transaction.
Discounts, shipping zones, payment fees, and acquisition channels can make two orders with the same revenue have very different margins. A paid social order might barely show a profit with high shipping and gateway fees, while an organic repeat order may make a lot of money if it is shipped locally.
Monitoring per-order margins gives teams better insights on an individual order basis, and it’s not always a simple spreadsheet exercise.
SKU-Level Profitability and Channel Analysis
When a brand knows how much of the order is contributing margin, it’s logical to next segment that same information into SKU, channel, and campaign buckets to identify trends.
SKU-Level Profitability
Not all best sellers are profit makers. A product may generate strong sales volume yet still deliver little profit once return rates, packaging costs, and marketing expenses are considered. SKU-level profitability analysis reveals these trends, enabling merchandising teams to decide which products to support in promotions, set pricing, and phase out products altogether.
Channel-Level Analysis
You need to sell through Shopify, Amazon, and a wholesaler at the same time, which makes each channel have a different cost structure. For instance, if market volume appears good, the contribution margin is squeezed by marketplace fees. Looking at contribution margin by channel, rather than revenue, is one way to see that a smaller owned-channel revenue stream can be more valuable than a larger marketplace-channel revenue stream.
| Channel Type | Typical Contribution Margin Range | Primary Margin Drag |
| DTC Website (Shopify, WooCommerce) | 25–40% | Marketing spend, discounts |
| Marketplaces (Amazon, Flipkart) | 12–22% | Platform commissions, return rates |
| Subscription/Repeat Purchase Models | 35–55% | Decline in recurring customer retention |
| Wholesale/B2B | 15–25% | Lower price points, bulk shipping costs |
Ecommerce Profitability Metrics That Work Alongside Contribution Margin
Contribution margin in eCommerce is most useful when compared to a handful of other related ecommerce profitability metrics, not on its own.
- Return on Ad Spend (ROAS): This is a measure of marketing efficiency and doesn’t take into account fulfillment or product cost, and hence a high ROAS campaign can also have a low contribution margin.
- Customer Acquisition Cost (CAC): Measures the cost of acquiring a customer, but does not indicate whether that customer will become profitable.
- Customer Lifetime Value (LTV): Can be useful when focusing on long-term value, but may mask short-term cash flow issues if the early-order contribution margin is negative.
- Average Order Value (AOV): Increases in AOV are good on a dashboard, but not necessarily indicative of increased profitability unless the contribution margin per order is also monitored.
ROAS and CAC tell you how efficiently you acquired transactions, while LTV tells you how valuable those customers are over time. Contribution margin then determines whether those transactions were ultimately profitable. None of them can tell the whole story, but contribution margin is the most likely to identify a problem before it becomes a cash crisis.
How to Improve Contribution Margin?
An improvement in contribution margin in eCommerce is unlikely to be due to a dramatic change. Typically, a series of smaller, targeted changes to pricing, operations, and marketing.
- Renegotiate Shipping and Fulfillment Rates: Carrier rates can be renegotiated based on volume, and a per-order discount can add up.
- Fewer returns at the source: Reduce returns at the source by using accurate product photos, detailed size guides, and transparent descriptions.
- Tighten Discount Strategy: Implementing sitewide discounts is less effective than targeted discounts for certain segments, as it drives down margins at a higher cost than incrementally adding revenue to the bottom line.
- Reallocate Marketing Spend by Margin, Not Just ROAS: A channel with a slightly lower ROAS, but a meaningfully higher contribution margin, may require more, not less, budget.
- Bundle and Upsell Strategically: Include a high-margin product in the package with a low-margin product to increase the average contribution margin per order without raising prices on the lower-margin product.
- Oversized Packaging and Fulfillment Costs: Audit packaging and fulfillment expenses regularly, as oversized packaging costs are often overlooked and can significantly reduce margins.
- Use Predictive, Not Reactive Forecasting: Brands that align their contribution margin with their sales forecasting software can plan their inventory and staffing accordingly, thereby avoiding the need to absorb rush costs and squeeze margins during peak periods.
Building an Ecommerce P&L Analysis Around Contribution Margin
A standard profit and loss report breaks down revenue, cost of goods sold, operating expenses, and net profit, and serves as a good summary of the overall picture, but the details of variable costs can be lost. A contribution margin-based eCommerce P&L analysis breaks this down into three layers, often referred to as CM1, CM2, and CM3, each removing a deeper layer of costs.
COGS and direct fulfillment costs are usually deducted from net revenue for CM1. CM2 also adds marketing spend. The real order-level profitability figure in CM3 is calculated without fixed overhead, after deducting payment processing and platform fees.
The benefit of such a P&L is that finance teams are able to identify which part of the company’s cost is responsible for the drop in margin, as opposed to “expenses went up. This approach enables finance teams to pinpoint exactly which cost category is driving margin erosion rather than relying on broad expense summaries.
This multi-layered approach also enables board reporting and investor conversations that reveal exactly how much of each sale remains after each major cost category until the bottom line, a benefit that can’t be beaten.
Tools and Technologies for Ecommerce Margin Analysis
If a business has at most one channel, such as Shopify, it’s simple to calculate earnings with a spreadsheet. Costs, sales, and margins can be manually tracked.
However, as the business expands and begins to sell through several channels, such as Shopify, Amazon, and retail shops, as well as the ads being displayed on various platforms, including Google, Meta, and others, things start to get complicated.
Various systems, including ad platforms, shipping companies, payment gateways, and order management tools, are involved, which are a diverse category of costs. Consolidating this data manually is time-consuming and often leads to reporting errors and delays.
This is where ecommerce analytics tools become important.
All this data can be compiled and made more accessible with tools such as ProactiveAI. They automatically gather data from sales channels, marketing platforms, and cost systems. Everything is well organized and easy to analyze.
Instead of building reports manually, users can simply ask questions in plain language, like:
- “What was our profit for each product last week?”
The system delivers instant answers, often accompanied by visual reports and charts. This saves time and eliminates technical data work.
These tools also show important business numbers together in one dashboard, such as:
- Contribution margin (real profit after costs)
- ROAS (return on ad spend)
- CAC (customer acquisition cost)
- AOV (average order value)
This lets marketing and finance view the same accurate data without having to use different spreadsheets.
Some platforms also come with forecasting tools that help businesses forecast future profits. For instance, they can observe the impact that an increase in ad spending could have on overall profit without spending the money.
Best Practices for Tracking Contribution Margin
There are a few habits that can help distinguish a brand with a solid grasp of contribution margin from one that has only calculated it once and forgotten it.
- Define a standardized set of variable cost categories and use consistent terminology across all teams.
- Check contribution margin weekly rather than monthly, because seasonal spend surges and promotional activities can impact margin so quickly that they won’t be captured by the monthly check.
- Consider segmenting by SKU, channel, and campaign as a default rather than using blended contribution margin as the basis for decision-making.
- Align contribution margin eCommerce goals with specific teams so marketing, merchandising, and operations all understand how they affect the number.
- Eliminate manual spreadsheet reconciliation as much as possible, as it is the single largest cause of delays or inaccurate contribution margin reporting.
How to Choose the Right Approach for Your Brand
Contribution margin tracking depends largely on whether a brand is large or small, the number of channels it has, and its data resources.
| Brand Profile | Recommended Approach |
| Early-stage, single channel | A clear and consistently used spreadsheet template that is checked and reviewed monthly |
| Growing, multi-channel (2–4 platforms) | A dedicated ecommerce dashboard with feeds pulled automatically from each channel |
| $1M+ monthly revenue brand | A conversational analytics AI chat layer and SKU- and channel-level dashboards |
| Multi-brand or multi-market operations | A complete self-service business intelligence environment with forecasting capabilities |
Manual tracking costs increase as a brand moves up layers, while the cost to implement the proper analytics platform does not increase as fast. This is typically the most obvious indicator that it’s time to change the strategy.
Conclusion
Revenue measures growth, but contribution margin determines whether that growth is sustainable. As advertising costs rise and marketplace fees continue to pressure profitability, brands that don’t track contribution margin lack a clear view of their financial health.
The correct calculation of contribution margin, combined with proper tracking at the channel, SKU, and order levels, provides a clear view of ecommerce profitability.
When paired with the right profitability metrics, it creates a common and accurate language for decision-making between finance and marketing teams.
Brands that make this discipline a habit from the outset enjoy greater confidence in scaling, knowing that every growth decision, whether it’s a new ad channel, a price change, or a discount campaign, is measured by the effect it has on profit, rather than sales.
Frequently Asked Questions
What is contribution margin in eCommerce?
In eCommerce, contribution margin is calculated by subtracting all variable costs associated with a sale from the sale price, including product cost, shipping, marketing, and payment processing fees. It shows actual profitability and not just sales figures.
How do you calculate contribution margin for an online store?
Net revenue is the total variable costs (COGS, shipping, marketing spend, payment fees, discount, and return effects). Divide the result by net revenue to get the contribution margin ratio as a percentage.
What is the difference between gross margin and contribution margin?
Contribution margin deducts all variable costs (including marketing and fulfilment) from revenue, whilst gross margin excludes all costs except cost of goods sold. Instead, the contribution margin is a better measure of an order’s profitability.
Why do brands with growing revenue sometimes see shrinking margins?
The expenses to acquire, the discounts to maintain growth, and the amount of returns will all increase as revenue increases. These variable costs go unnoticed and erode the contribution margin even as the top line rises.
How do you track contribution margin by SKU or channel?
Spread variable costs, such as marketing and shipping, across individual SKUs/channels rather than using blended averages. This can be done automatically with an ecommerce analytics dashboard or platform like ProactiveAI that can connect multiple data sources.
You might also like
Handpicked articles for your reading list.

Get the latest insights on Conversational AI
Stay ahead of the curve with weekly updates on data analytics, AI trends, and eCommerce growth strategies delivered straight to your inbox.
Join 5,000+ industry leaders. Zero spam, just pure insights.