


eCommerce
eCommerce
New vs. Returning Customers: Why Tracking Both Separately Is Critical for eCommerce Growth
-
Vikash Sharma
- Jun 23, 2026
- 10 mins read
While the total revenue is the basis of most ecommerce dashboards, this metric can be misleading because it doesn’t reveal the sources of growth. It’s one thing to make $500,000 per month through constant acquisition, and quite another to make the same amount from repeat customers. That’s why the new vs returning customers ecommerce analysis is important.
Blended metrics, such as ROAS, conversion rate, or average order value, combine two different types of customers, making it more difficult to determine what is driving results.
Acquiring new customers is more expensive, while returning customers typically deliver greater long-term value and more predictable revenue. These splits enable teams to gain a deeper understanding of how each audience type is performing across acquisition, retention, and revenue growth.
In this guide, you’ll learn how to keep track of new vs returning customers’ ecommerce data, how to measure the right metrics for each group, how to understand a healthy acquisition-retention balance, and how to build a data-driven growth strategy with a higher level of confidence.
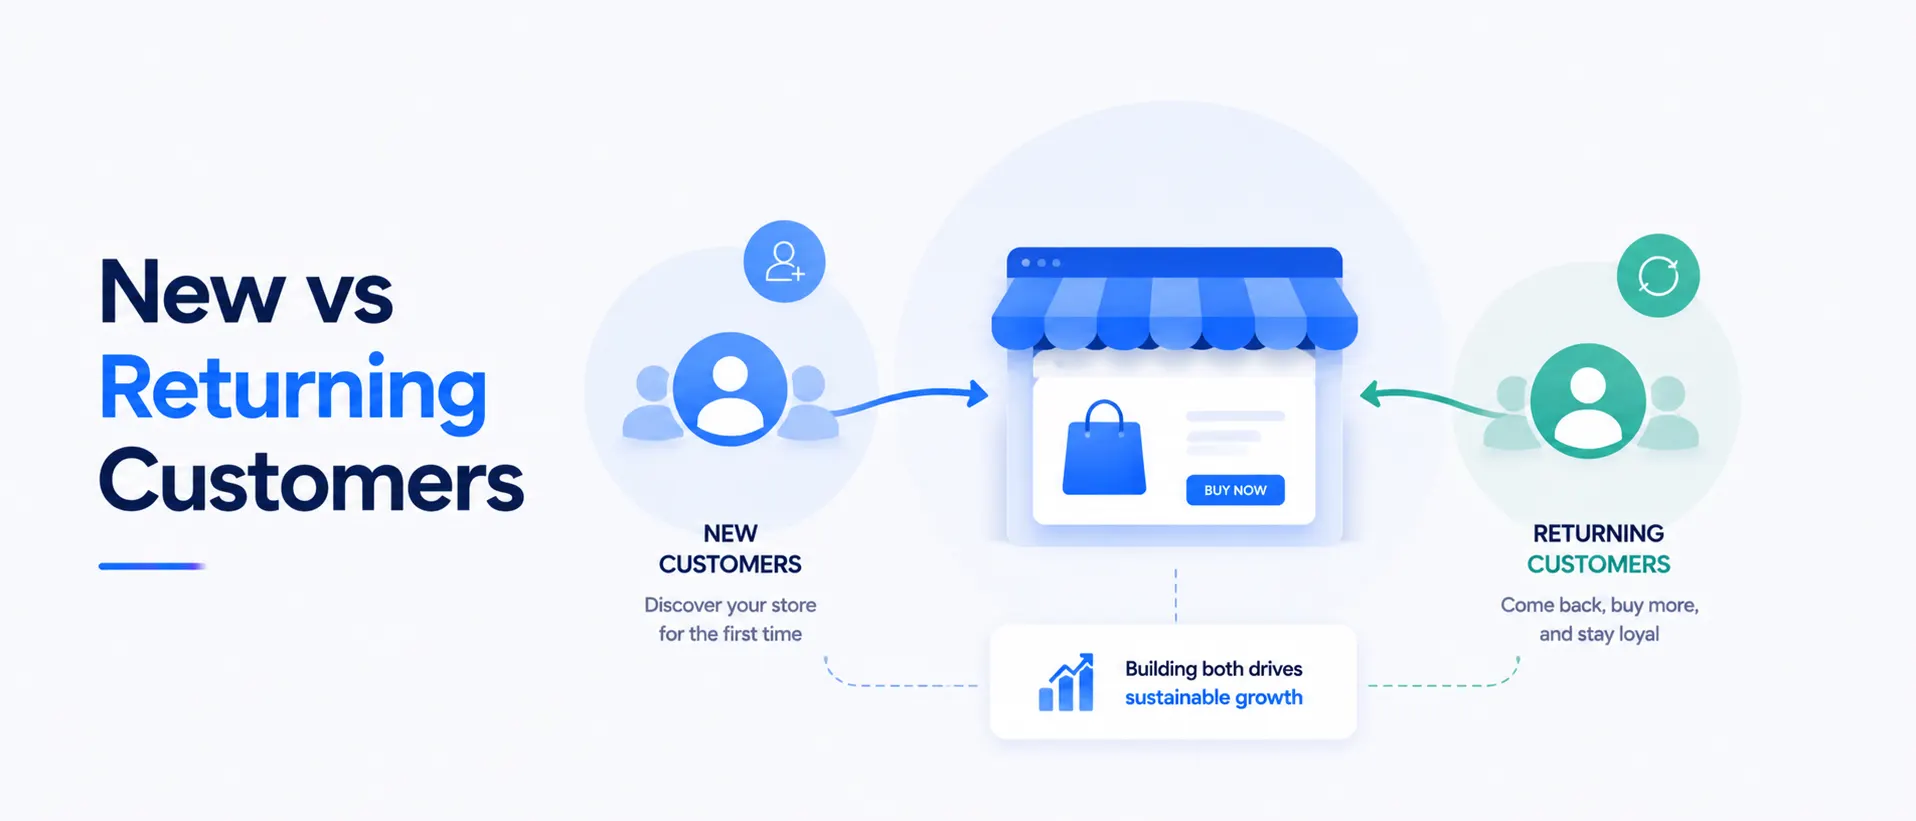
What Are New and Returning Customers in eCommerce?
eCommerce customers fall into two categories: new customers and returning customers. The effects of these two groups on growth are very different. While repeat customers may be more profitable, quick to convert, and spend more in the long run, new customers still need to be acquired and nurtured.
Separating the two groups allows brands to determine the source of growth, whether it’s from new customers or repeat customers. In the modern era, conversational AI in ecommerce simplifies this analysis to the point of providing answers to queries such as “What percentage of revenue is coming from returning customers this month?” with instant results from the order data.
Why Blended Metrics Hide the Real Growth Story?
Blended metrics can create the impression of strong performance when actual performance is much weaker. Blended ROAS, for instance, includes revenue from both new and repeat customers, obscuring the true results of customer acquisition.
When revenue is split, the new-customer ROAS can be much lower than the blended ROAS. Monitoring it on its own gives a company a more complete picture of the acquisition’s effectiveness and enables better marketing investment decisions.
| Metric | Blended View | Segmented View |
| Total Revenue | $80,000 | New Customers: $25,000 / Returning Customers: $55,000 |
| Ad Spend | $20,000 | $20,000 (entirely acquisition-driven) |
| ROAS | 4.0 | New Customer ROAS: 1.25 |
| Interpretation | “Performance of ads is excellent.” | Acquisition is only marginally profitable; retention is driving most of the revenue and overall performance. |
That is why it is not enough to consider eCommerce acquisition vs retention at an overall level. It’s necessary to dive into specific metrics. If your blended ROAS appears misleading, returning customer revenue may be masking inefficient acquisition spending. Brands can identify problems early and strategically shape their growth with a clear focus on their acquisition and retention performance.
What are the metrics that should be tracked separately?
There are a few key metrics that form the foundation of a reliable new vs. returning customers ecommerce tracking framework. They require a separate number for new customers and another for existing ones, and averaging the two does not help.
Returning Customer Rate. Ecommerce returning customer rate is the number of all customers during a period who have bought previously, expressed as a percentage:
Returning Customer Rate = (Returning Customers / Total Customers) x 100
Obviously, a meaningfully higher rate is to be expected if the brand is a consumables business selling supplements or coffee than if it sells furniture.
1. New Customer ROAS
As you can see in the example above, new customer ROAS only attributes revenue to ad-driven customers who are new to the business. True to its name, it measures new customer revenue generated from paid channels divided by total ad spend and is a much better metric for budget decisions than blended ROAS.
2. New Customer Revenue Tracking
New Customer Revenue is a metric that measures the share of overall revenue attributable to new customers over a specific timeframe. This metric answers a question that blended revenue can’t solve: has the business attracted new customers, or is the same group of loyal customers just spending more?
3. New vs Repeat Customer Ratio
The new vs repeat customer ratio is calculated as the number of new customers divided by the number of repeat customers over a given period and is typically presented as a simple ratio (e.g., 60:40) to make it easy to communicate with non-analytical stakeholders.
4. Returning Visitor Analytics
First, there’s a visit, before a purchase occurs. Visitor analytics for returning visitors help you understand the number of visitors who return to your site versus first-time visitors, a valuable leading indicator. When an increasing percentage of the visitors who return to your website have not yet bought again, it may indicate a forthcoming retention opportunity.
5. First Time Buyer Analytics
First-time buyer analytics explore new customer behavior, such as average order value, the first product they purchase, the channel they come through, and their time to purchase. This is crucial to maximizing the top of the funnel without skewing the funnel by returning customer behavior.
6. Ecommerce Customer Mix
An eCommerce customer mix shows the percentage of revenue, orders, and customers that come from new versus returning customers. This is the number that should be examined monthly by number leadership, one that shows how healthy the business is, more accurately than mere revenue growth.
|
Metric |
What It Measures |
Why It Matters |
| Returning Customer Rate | Percentage of customers who have purchased previously and returned to buy again. | Core loyalty signal. |
| New Customer ROAS | Advertising efficiency is measured only on first-time buyers who have not seen the ad before. | Reveals true acquisition profitability. |
| New Customer Revenue | Revenue generated specifically from first-time buyers; tracked in real time. | Helps understand the true rate of customer growth. |
| New vs. Returning Customer Ratio | Ratio (or count comparison) of new customers to repeat customers. | Simple, stakeholder-friendly view of customer acquisition and retention balance. |
| Returning Visitor Analytics | Visitor behavior and site visits that occur prior to a repurchase. | Early retention signal. |
| First-Time Buyer Analytics | Behavior of new customers and performance of acquisition channels. | Optimizes the acquisition funnel. |
| Ecommerce Customer Mix | Combined split of revenue, orders, and customers between new and returning segments. | Provides a health check of the entire business. |
What a Healthy Customer Mix Looks Like
Customer mix should change with brand growth, and the correct ratio also depends on the business model. Return rates over 40% are natural for consumables (supplements, coffee, skin care), as the product is used up and there is a natural need to reorder.
Fashion brands typically experience seasonal repurchase cycles, while home goods and durable product brands rely more heavily on new customer acquisition because repeat purchases occur less frequently.
If the model is subscription- or membership-based, the percentage of new DTC customers should decline over time as the subscriber base matures.
Within any category, the mix should continue to evolve as the brand ages. New customer revenue is likely to be the largest contributor in the early stage (0-6 months), as there is not enough time for a significant repeat-buyer base to develop.
A balanced split around 50/50 is a sign that acquisition and retention are both working in the growth stage (6-18 months), and this is typically when the new vs repeat customer ratio becomes a regular topic of discussion in marketing meetings.
At maturity (18 months and older), revenue from past acquisition investments should constitute the bulk of it, often 60% or more, because these investments generate recurring, lower-cost income.
|
Stage |
% of New Customers Expected to Be Acquired | % of Customers Expected to Return to the Store |
What to Watch For |
| Early (0–6 mo) | 70–80% | 20–30% | There is no need to panic about the term “low loyalty.” |
| Growth (6–18 mo) | ~50% | ~50% | Acquisition shifted towards balance, while retention stalled. |
| Mature (18+ mo) | 30–40% | 60–70% | When shares fall below 20%, the acquisition process halts. |
There are two warning patterns to note. Retention may be underperforming if new customer revenue remains over 80% well after 18 months: customers buy once, and they’re gone, and the brand is dependent on ever-increasing acquisition costs with nothing compounding behind.
When revenue from existing customers rises to more than 80% of total revenue, but the number of new customers doesn’t increase, the brand could be riding a wave of loyal customers who are getting older, and new customer acquisition simply isn’t keeping up. Both look good on a blended revenue chart, and both are apparent once the data is separated.
Popular Tools & Platforms for Tracking Customer Mix
The selection of the appropriate tool will depend on the depth of the segmentation required and the amount of manual set-up a team is willing to undertake.
ProactiveAI is specifically designed for eCommerce teams that require new vs. returning segmentation without manually building it from raw exports. It automatically segments new-customer revenue, returning-customer revenue, new-customer ROAS, and returning-customer rate in its ecommerce analytics dashboard, which is updated regularly.
The customer mix view is accurate across channels, as it is directly connected to Shopify, WooCommerce, Meta Ads, and Google Ads, eliminating the need to manurally combine platform-native reports.
For teams looking to do more than just report, ProactiveAI’s forecasting engine can predict future new versus returning revenue, which can be helpful for inventory and budget planning in advance of seasonal peaks.
If teams prefer asking questions over building reports, ProactiveAI’s conversational AI analytics allows anyone to type or speak a question, such as “what was our new customer ROAS last week,” and receive an instant answer that is directly extracted from connected store and ad data.
Shopify Native Analytics has a simple first-time vs. returning filter in Customer reports, which is a good place to start for smaller stores, but it doesn’t offer channel-level breakdowns or allow you to link customer mix to ad spend to get a true new-customer ROAS.
Google Analytics 4 (GA4) can be set up to identify new and returning users via custom segments, but it is more about site behavior than about revenue-level segmentation.
For very early-stage stores with a small number of customers per month, spreadsheet-based tracking may work for a short time, but it doesn’t scale and becomes error-prone once orders exceed a few hundred per month.
|
Tool |
Customer Mix Depth | Ad Spend Integration | Forecasting |
Natural Language Queries |
| ProactiveAI | Full, automated | Yes (Meta, Google) | Yes | Yes |
| Shopify Native | Basic | No | No | No |
| GA4 | Moderate, setup-dependent | Limited | No | No |
| Spreadsheets | Manual, limited | Manual only | No | No |
Best Practices for Tracking New vs. Returning Customers
Accurately distinguish first-time buyers from repeat customers using CRM, analytics, and purchase history data to gain deeper insights into customer behavior. Regularly monitor these segments to optimize marketing strategies, improve retention, and increase customer lifetime value.
Compute New Customer ROAS From Day One
When blended ROAS appears misleading, it may indicate that budget decisions are based on inaccurate performance assumptions.
Check the customer mix monthly, not quarterly
Review your customer mix every month rather than quarterly to identify shifts in new and returning customer trends as early as possible. Early detection of a decline in repeat customers allows businesses to take timely corrective actions, improve retention strategies, and prevent long-term revenue loss.
Break down by acquisition source
A channel that brings in new customers with a high ROAS on their first purchase but no subsequent purchases is less valuable in the long term than a channel that brings in new customers with a high ROAS on their first purchase and then a high ROAS on their second purchase.
Match retention tactics to natural repurchase cycles
If you send a winback email too early, the customer will be annoyed, and if you send it too late, the customer will have already purchased elsewhere.
Do not use absolute customer numbers
If you have 100 new customers and 200 existing customers, and they increase to 120 new and 210 existing customers, it appears that you are growing faster than you are retaining customers.
Use customer mix as a leading indicator
The new vs repeat customer ratio is often a first indicator of changes in total revenue, and should be a permanent part of any AI dashboard, not just pulled when something feels amiss.
How to Choose the Right Analytics Approach
There are three honest questions to consider. How much engineering time can be saved? A brand with a dedicated data team can create new-versus-return logic in-house, whereas one without can gain more from a platform that automates segmentation.
How many channels are required to be merged? When acquisition spans Meta, Google, and TikTok, the solution must integrate customer mix data from all three platforms. The team is left with the task of manually reconciling weekly exports.
Who will be using the data? When one analyst is responsible for customer mix, a technical setup is sufficient; when marketing, merchandising, and leadership require visibility, a self-service analytics approach becomes much more important, as it eliminates the need to wait for one person to produce each report.
It’s also where the wider trend of AI business intelligence is driving expectations. Teams are looking to ask a question and receive a response, not a custom report, and wait days for it.
Conclusion
Blended metrics will always tell a simpler story than the truth. Total revenue, blended ROAS, and overall conversion rate are easy to calculate because they combine two very different customer behaviors into a single metric, but they’re not very accurate. New and existing customers have different purchasing behaviors and send different signals about the business’s future.
Separating new and returning customer eCommerce data does not require advanced analytics or a dedicated enterprise data team for their data scientists to access. Whether it’s using native platform tools, configuring GA4, or using a custom-built analytics platform like ProactiveAI that automates segmentation from the get-go, it’s a basic practice any growing eCommerce brand can implement.
Once that separation has occurred, all other decisions become more focused: how to allocate budget between acquisition and retention, the actual ROI of the ad spend, and an early warning system for when growth begins to run on borrowed momentum. The brands that are doing well in 2026 aren’t simply seeing revenue increase. They’re observing where it’s coming from, and they’re making adjustments before the blended number can fool them.
Frequently Asked Questions
What is the difference between new and returning customer metrics in eCommerce?
New customer metrics measure only first-time customers, including conversion rate, average order value, and acquisition cost. Returning customer metrics track repeat purchase rate, average order value for returning customers, and time between orders. Each set provides a different set of business health indicators.
What percentage of revenue should come from new vs. returning customers?
It is dependent on the age of the business. Brands in the early stage usually get 70-80% of their revenue from new customers, growth stage brands are more likely to have a balanced mix of new and repeat customers, and mature brands can have 60% or more of their revenue coming from repeat customers, depending on the product category and frequency of repurchases.
Why should DTC brands optimize for new customer ROAS separately from blended ROAS?
Blended ROAS combines ad-generated revenue with revenue from customers who would have bought regardless of the ads, leading to an overestimation of ad performance. New customer ROAS separates out the real efficiency of acquisition, providing a true metric for DTC brands to scale or reduce ad spend.
How do you track new vs. returning customers accurately in Shopify?
Shopify’s built-in Analytics provides a simple first-time vs. returning filter in Customer reports. Brands usually link to a dedicated platform, such as ProactiveAI, that automates segmentation and links customer data with revenue and ROAS for greater accuracy across channels and ad spend.
What does a healthy new-to-returning customer ratio look like?
The healthy ratio changes over time: it is heavily new-customer-weighted in the first 6 months, balanced during growth, and increasingly returning-customer-weighted as the brand matures, usually around 30-40% new and 60-70% returning.
You might also like
Handpicked articles for your reading list.
Get the latest insights on Conversational AI
Stay ahead of the curve with weekly updates on data analytics, AI trends, and eCommerce growth strategies delivered straight to your inbox.
Join 5,000+ industry leaders. Zero spam, just pure insights.