


AI & Analytics
eCommerce
Media Mix Modeling for eCommerce: What It Is and When You Need It
-
Varun Kumar
- Jun 26, 2026
- 9 mins read
You are paying thousands, maybe hundreds of thousands, on Meta ads, Google, TikTok, influencers, email, and possibly a podcast or two. However, when your CMO asks, “Which channel is actually driving revenue?” you find yourself with a bunch of last-click dashboards, platform-reported numbers that are inconsistent, and attribution reports that differ.
Sound familiar? You’re not alone.
For a lot of eCommerce brands, the issue isn’t just how much they spend on marketing, but also what works. Traditional attribution can no longer be trusted on its own, thanks to cookie deprecation, changes in iOS privacy, walled-garden reporting, and channel overlap.
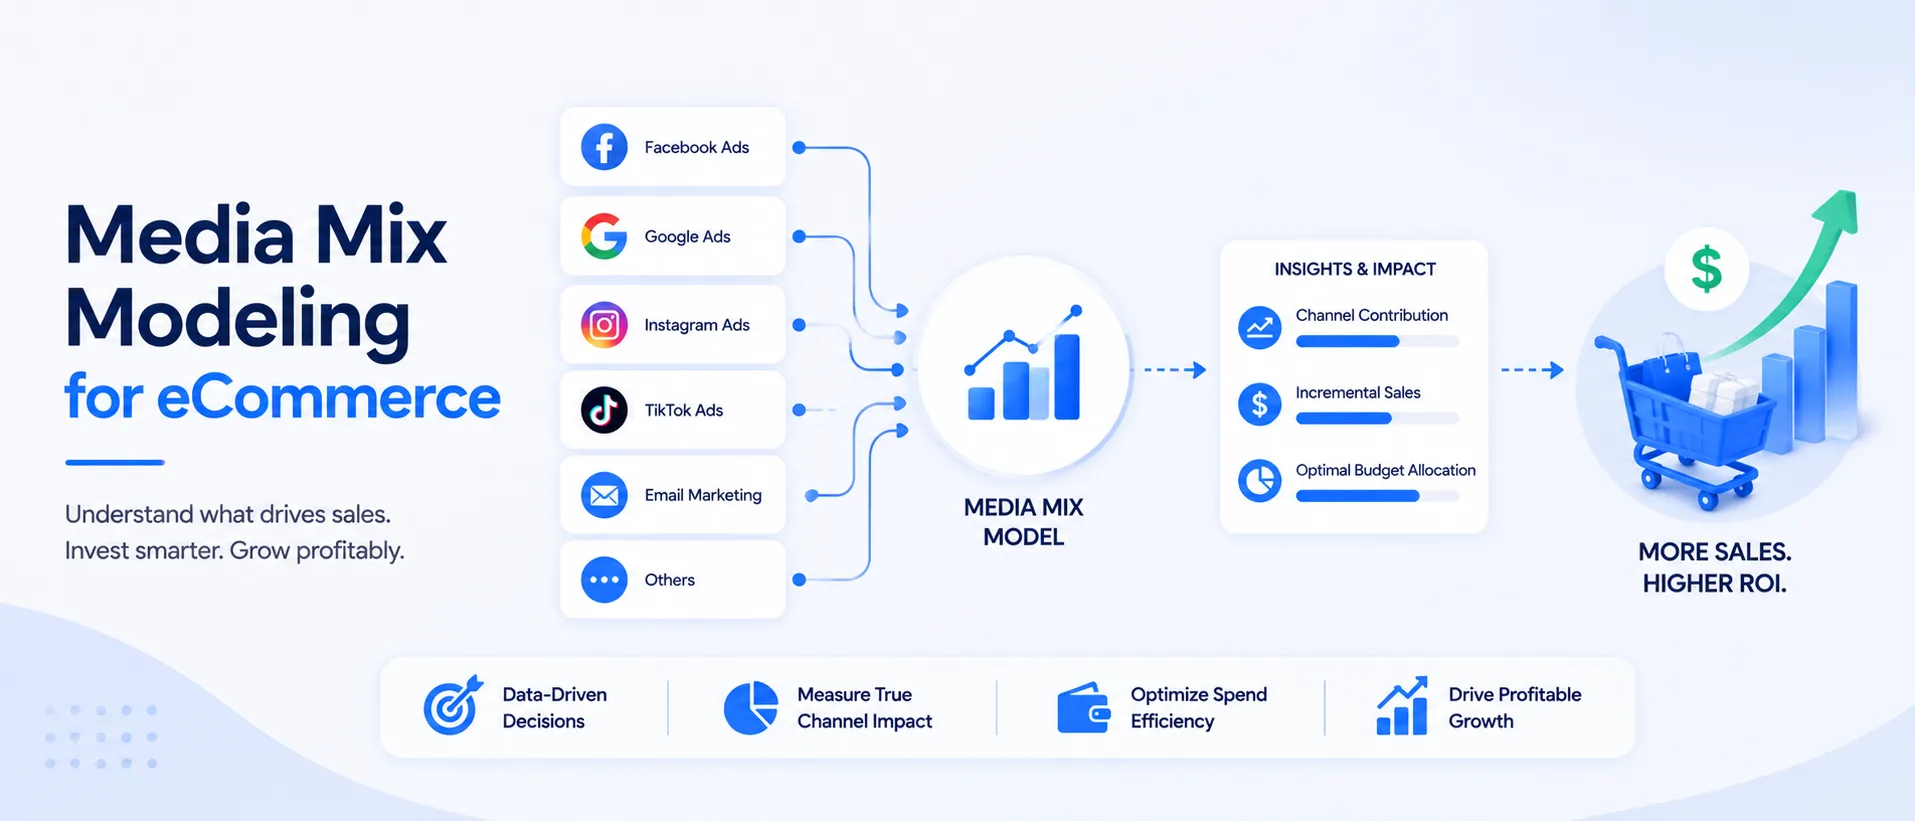
Media mix modeling for eCommerce comes to the rescue at this point. MMM is a statistical technique that analyzes historical marketing investments across all channels and connects them to real business outcomes such as revenue, sales, and customer acquisition. It provides a channel-agnostic, privacy-safe view of marketing performance, helping businesses understand which activities are truly driving growth.
The payoff? Better budgeting, reduced spending waste, and a marketing plan, based on facts and data, not instinct.
What Is Media Mix Modeling (MMM)?
Media mix modeling, also known as marketing mix modeling, is an econometric technique used to measure the impact of each marketing channel on business outcomes such as revenue and conversions.
In other words, rather than tracking an individual customer’s path and assigning credit to the last click, MMM considers the “last click” model too simplistic and asks, “If we were to look back across all our customers within the past year, what spending habits are most closely correlated to sales activity?
MMM can analyze aggregated and time-series data, including your weekly Meta spend, TV impressions, email sends, seasonal promotions, and external factors like holidays or economic trends. It then creates a regression model to isolate and measure the individual impact of each variable.
The output will be a set of response curves and attribution coefficients that will inform you statistically:
- The amount of additional revenue that each channel contributes
- Where diminishing returns begin per channel
- How best to spend the money going forward
When using a MMM, there are no cookies, pixels, or user-level data involved, unlike click-based tracking. It operates only on aggregated data and is thus inherently privacy-safe and future-proof.
How Media Mix Modeling in eCommerce Works: The Core Components
The model generates response curves and attribution coefficients that help marketers understand:
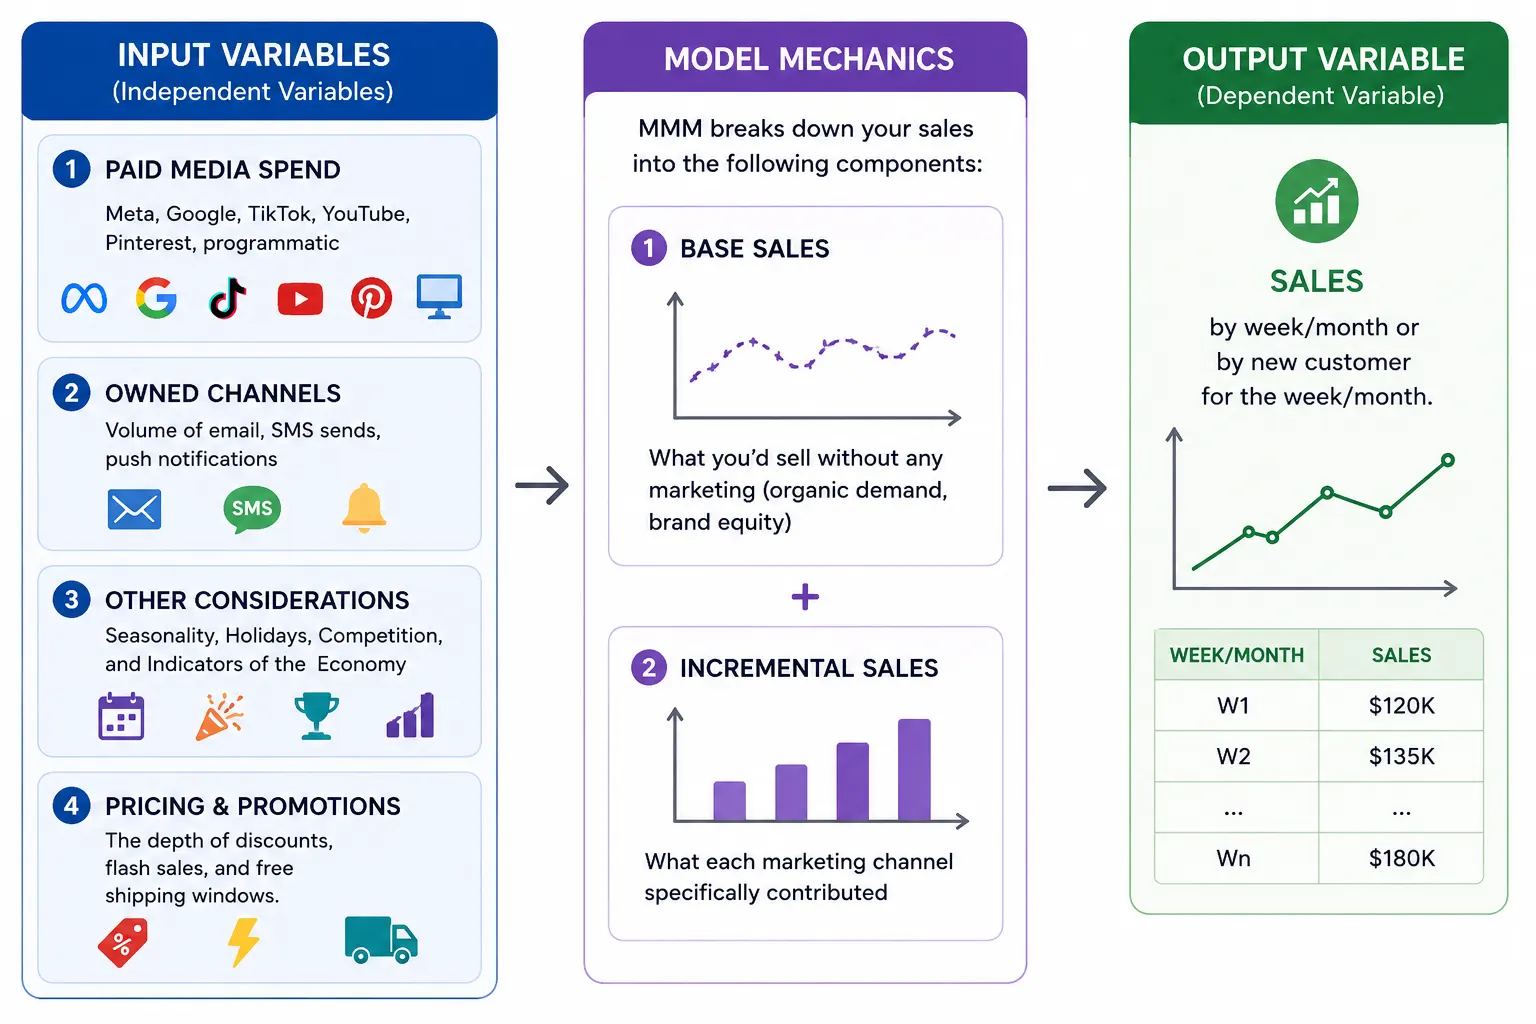
Input variables (Independent variables)
- Paid media spend: Meta, Google, TikTok, YouTube, Pinterest, programmatic
- Owned channels: Volume of email, SMS sends, push notifications.
- Other considerations: Seasonality, Holidays, Competition, and Indicators of the Economy
- Pricing and promotions: The depth of discounts, flash sales, and free shipping windows.
Output Variable (Dependent Variable)
- The dependent variable typically includes weekly or monthly sales revenue, conversions, or new customer acquisitions.
Model Mechanics
MMM breaks down your sales into the following components:
- Base sales: what you’d sell without any marketing (organic demand, brand equity)
- Incremental sales: what each marketing channel specifically contributed
Modern tools also feature adstock transformations (to account for the lag and decay of ads) and saturation curves (to account for diminishing returns as you increase spend on any given channel).
MMM vs. MTA eCommerce: Understanding the Difference
Many eCommerce analytics teams eventually need to determine when to use MMM versus MTA.
| Dimension | Media Mix Modeling (MMM) | Multi-Touch Attribution (MTA) |
| Data Level | Aggregated (channel-level) | User-level (individual customer journeys) |
| Privacy Impact | No cookies required; privacy-safe | Relies on cookies, pixels, and user identifiers |
| Channel Coverage | Covers all channels, including offline media | Primarily focused on digital channels |
| Time to Insight | Weeks (requires model training and analysis) | Real-time or near-real-time reporting |
| Granularity | Channel and campaign level | Touchpoint and creative level |
| Best For | Strategic budget planning and allocation | Tactical, in-campaign optimization |
| Accuracy After iOS Privacy Changes | Largely unaffected by tracking restrictions | Declining due to reduced user-level tracking visibility |
The honest answer? Neither MMM nor MTA delivers complete measurement capabilities when used independently. No competition, only a complement between MMM vs MTA eCommerce. MMM supports strategic budget planning, while MTA enables tactical campaign optimization. They combine to create a unified measurement, which is the term used by practitioners.
For most brands, MMM is the basis on which they inform you where to invest. Once it is deployed, MTA will tell you how to manage it.
When Do Brands Require Media Mix Modeling for eCommerce?
Marketing mix modeling is no longer limited to Fortune 500 enterprises. However, there are definite signs that signal the right time.
Strong Signals You Need MMM Now:
- Your platform numbers don’t add up: According to Meta, it converted 4,000 people. Google says it drove 3,500. You ordered 5200 items. Yes, there’s a problem with overlap.
- You’re spending across 4+ channels: As you increase the number of channels, you increase the number of interaction effects, making it more difficult to provide attribution without a model.
- You’ve hit a growth plateau: When you’re already spending a lot of money within the same budget but not getting the same return, MMM can help you figure out where you’re misallocating and where there is opportunity.
- You’re making major financial adjustments: Before doubling up on TikTok advertising or removing YouTube from the budget altogether, you’ll need to get a forecast from the data.
- Privacy changes have degraded your attribution: Post-iOS 14/17, if your MTA data feels increasingly unreliable, MMM becomes your most trusted source of truth.
A Rule of Thumb:
Most experts will say that the value of MMM is realized at about $2-5M in annual marketing spend, though in today’s world of modern tooling, that figure is much lower. The applicability of MMM for smaller DTC brands is discussed later in this article.
What Data Do You Need to Run MMM?
A good example of a media mix model to run would be a minimum of 1 to 2 years of weekly data for the following categories:
Core Data Inputs:
- Marketing spend by channel and week (where achievable, broken down by campaign type)
- The amount of money generated or conversions (your dependent variable, preferably from your source of truth like Shopify, WooCommerce, or your data warehouse)
- Awareness channel metrics, including impressions, GRPs, and associated media spend
- Promotion and pricing information, discount events, sales periods, and product releases
- Seasonal trends and external variables/conditions: holiday schedules, CPI data (if any), competitor promotions.
Data Quality Requirements:
- The granularity of the dates: the default is weekly, but a different period can be used.
- There are no significant gaps in the time series.
- The spend data is broken down by channel rather than grouped into buckets.
The better the data inputs, the better the media mix model accuracy. This is particularly true for the regression-based ones. Poor data quality inevitably leads to unreliable model outputs.
This data is retrieved and aggregated by multiple teams using a self-service analytics strategy, then fed into an MMM engine, making data preparation orders of magnitude faster.
Tools Worth Knowing for Media Mix Modeling in eCommerce
Recent advances in open-source frameworks and SaaS platforms have significantly expanded access to MMM capabilities. The most relevant options, depending on the maturity levels:
| Category | Platform | Description |
| Open-Source / DIY | Meta Robyn | Open-source MMM framework developed by Meta’s marketing science team. Powerful but requires R expertise and significant setup effort. |
| Google Meridian | Google’s Bayesian MMM framework (2024), built in Python and gaining adoption across analytics teams. | |
| Managed / SaaS Platforms | Northbeam | Strong MTA platform with MMM capabilities, popular among mid-market DTC brands. |
| Sellforte | A causal inference-focused platform designed for eCommerce and retail measurement. | |
| Nielsen / Analytic Partners | Enterprise-grade MMM solutions with extensive consulting and strategic support. | |
| ProactiveAI | eCommerce analytics platform that combines MMM insights, forecasting, and scenario planning in a marketer-friendly dashboard. |
Best Practices for Accuracy in Media Mix Modeling for eCommerce
The Media Mix Model is only as reliable as the methodology upon which it is based. Here are some practices that differentiate reliable models from misleading ones:
1. Validate With Incrementality Testing
Remember to always test MMM outputs against incrementality testing eCommerce experiments. The gold standard: geo holdout test (also known as geo lift test) retains a set amount of ad spend in specific geographic markets for a set period and compares the revenue increase or decrease with the control markets. When the geo holdout results match the MMM result, your model has good predictive validity.
2. Use Bayesian MMM Where Possible
However, with Bayesian systems (such as Google Meridian or Robyn), you can feed prior information into the model that can help mitigate uncertainty, such as the fact that TV has a longer adstock window, and yield more calibrated results.
3. Refit Models Regularly
Marketing dynamics change. The channel dynamics from before the pandemic are not accurately reflected by a model trained before then. Re-evaluate your MMM every 3-6 months as additional spend and revenue information becomes available.
4. Don’t Ignore Base Decomposition
One of the most revealing results for eCommerce brands is knowing how much of your sales comes from organic (or “base”) traffic versus marketing (or “incremental”) traffic. Many brands discover that 40% to 60% of revenue would occur without paid advertising, fundamentally reshaping how they evaluate marketing ROI.
5. Pair MMM with Your eCommerce Reporting Dashboard
The most successful MMM configurations integrate the models into your operational reporting system. This can be achieved with ProactiveAI, which allows you to correlate MMMs with your live ecommerce kpi dashboard, so your team can track budget efficiency, not in a disconnected spreadsheet.
Can Small DTC Brands Use MMM?
It really depends on what you consider “small” and what tools you use.
Over the last two years, MMM for small eCommerce has become much more accessible. The cost of traditional MMM consulting was $500K+ until now, when open-source tools such as Robyn and Meridian have taken the place. Likewise, new SaaS solutions have made entry-level MMM accessible to brands with marketing budgets in the $500K–$1M range.
But some real limitations apply:
- Data volume: MMM requires 52-104 weeks of clean weekly data. This simply isn’t available from newer brands.
- Channel diversity: If you’re only on one or two channels, there’s not enough diversity in the data to have any real purpose in making a model.
- Internal capacity: Someone must be able to interpret the outputs and translate them into budget decisions.
In the case of a very early-stage DTC brand (annual ad spend of less than $1M and less than 2 years of data), there is a simpler option than a full-fledged MMM: a marketing mix modeling explainer approach, such as a regression model or a channel-level incrementality experiment.
After spending around $1M to $2M a year with steady data for 18+ months, it’s time for the real deal. Tools like ProactiveAI are built to grow with you, beginning with exploratory analysis using conversational AI analytics and expanding to comprehensive statistical modeling as your data matures.
Why ProactiveAI Is Built for Media Mix Modeling for eCommerce?
ProactiveAI is designed specifically for eCommerce and DTC brands seeking deeper visibility into marketing performance. It combines data from paid media channels, Shopify or WooCommerce stores, and CRMs into a single MMM-ready dataset without requiring any complicated engineering work.
It’s unique in its ability to transform measurement into action. With AI-powered budget simulations, teams can see the potential effects of changes to their channel spend on future revenue, making marketing budget optimization easier and more data-driven.
The platform also caters to marketers, not data scientists. Engage in conversation with the channel’s performance, analyze contributions, and get insights without SQL.
ProactiveAI also enables incrementality testing and provides MMM insights and metrics like revenue, CAC, ROAS, and LTV, all within a single platform.
Conclusion
The marketing measurement world has changed dramatically. Last-click attribution, trusting good ROAS based on platform data, and scaling based on what “the dashboard says is working” is no longer enough. It failed due to privacy changes, walled gardens, and multi-channel complexity.
The most comprehensive, safest (in terms of privacy), and most strategically sound system available today for understanding the impact of your marketing is media mix modeling for eCommerce. It’s not the end-all, be-all of a marketing measurement solution, but with incrementality testing and whatever additional MTA signals you can get, it’s the foundation of a modern one.
For a $2M DTC brand, whether that’s just wondering if TikTok is truly converting or a $50M retailer looking to optimize across a dozen channels, MMM provides you with the backing you need to make sure you’re making a smart investment.
Having so many platforms like ProactiveAI that make the data preparation, modeling, and insight delivery so easy to access makes the hurdle to get started less daunting.
Frequently Asked Questions
What is a good eCommerce conversion rate in 2026?
A good eCommerce conversion rate typically ranges between 2% and 4%, while top-performing online stores often achieve 5% or higher. The ideal benchmark varies by industry, product type, and traffic source.
What are the highest-impact CRO changes for product pages?
The most effective product page optimizations include improving product images, strengthening calls to action (CTAs), adding customer reviews, clarifying pricing and shipping information, and optimizing page load speed.
How does site speed affect eCommerce conversion rate?
Site speed directly impacts conversions. Even a 1-second delay in page load time can increase bounce rates and reduce purchases, while faster pages improve user experience and sales.
What A/B tests have the biggest impact on eCommerce revenue?
High-impact A/B tests typically focus on CTA buttons, product page layouts, pricing displays, checkout flows, product images, and trust signals such as reviews and security badges.
How do you calculate and track conversion rate in Shopify?
In Shopify, conversion rate is calculated as (Total Orders ÷ Total Website Visitors) × 100. You can track this metric in the Shopify Analytics dashboard to monitor store performance and identify opportunities for optimization.
You might also like
Handpicked articles for your reading list.
Get the latest insights on Conversational AI
Stay ahead of the curve with weekly updates on data analytics, AI trends, and eCommerce growth strategies delivered straight to your inbox.
Join 5,000+ industry leaders. Zero spam, just pure insights.